Intelligence Degradation in Long-Context LLMs: Critical Threshold Determination via Natural Length Distribution Analysis
Intelligence Degradation in Long-Context LLMs — L2 #
§1 TL;DR #
Qwen2.5-7B 在上下文长度达到最大容量 40–50%(≈55K tokens/128K)时 F1 从 0.556 骤降至 0.302(降幅 45.5%),通过 natural length distribution analysis + 五方法交叉验证精确定位 critical threshold 于 43.2%,并以 RoPE aliasing / attention dispersion / information bottleneck 三视角统一解释。
§2 Q1 / Q2 / Q3 #
Q1 · 痛点 #
LLM 标称支持 128K 上下文,但实际部署中用户观察到上下文长度超过某个不确定阈值后性能"悬崖式"崩塌。现有研究仅限闭源模型、采用 truncation/padding 引入 artifact、阈值判定依赖视觉检查缺乏统计严谨性、且无统一的退化解释框架。
Q2 · 方法 #
- Natural Length Distribution Analysis: 对每个样本使用原生 token 长度(无截断/填充),消除人工 context manipulation 的 confounding,直接建立 $(r_i, p_i)$ 因果对。
- 五方法交叉验证阈值检测: gradient analysis、second derivative、binned statistics、percentile threshold、sliding window — 共享三阶段过滤(multi-peak detection → rise-in-range filtering → sustained decline verification),最终取中位数。
- Shallow Long-Context Adaptation 统一框架: 三视角(information bottleneck, attention dispersion, RoPE extrapolation failure)+ Theorem 1: $L_c = \min\{L_{\text{RoPE}}, L_{\text{attention}}, L_{\text{info}}\}$。
- Critical threshold = 43.2%(std dev 1.2%),F1: 0.556 → 0.302(45.5% 降幅)
- 统计显著: $p < 0.001$, Cohen's $d = 8.2$(极大效应)
- 理论预测(RoPE aliasing @49%)与实证(43.2%)相对误差 13.4%,差异由 attention/information bottleneck 率先触发解释(Theorem 1 validated)
- Natural length vs. truncation: variance 1.2% vs. 3.2%,前者 causal evidence 更强
- Def 1 $I(L) = \text{F1}(L)$: 将"智能"操作化为特定任务在给定 context length 下的 F1 — 回避了抽象 intelligence 定义,直接可测。
- Def 2 $D(L) = (I(L) - I(L+\Delta L))/I(L) \times 100\%$: 相对退化率,衡量 context length 增量引起的性能损失比例。
- Def 3 (Cliff-like): $D(L_c) > 30\%$ + 持续性(超过 $L_c$ 后 $I$ 不恢复至 50%)— 区分"悬崖"与"缓坡"退化。
- Def 4 $\eta(L) = I(X;Y|L)/H(X|L)$: 信息传输效率 — 衡量模型从长 context 中提取有用信息的比例。概念框架(直接测量需要模型内部访问)。
- Def 5 $C(A,L) = (1/L)\sum_i \max_j A_{ij}(L)$: attention 聚焦度 — 每个位置的最大 attention 权重平均值。$C$ 高 = attention 集中,$C$ 低 = attention 分散。
- Theorem 1 $L_c = \min\{L_{\text{RoPE}}, L_{\text{attention}}, L_{\text{info}}\}$: 三个独立瓶颈谁先触发谁决定 critical threshold — 对 Qwen2.5-7B 是 attention/info (≈42–44%) 先于 RoPE (49%)。
- 三阶段过滤的参数敏感性极低: window size $w$ ∈ [3, 7] → threshold 变化 ±0.5%;rise-in-range 阈值 10% ∈ [5%, 15%] → ±0.3%;rebound 阈值 85% ∈ [80%, 90%] → ±0.4%。这意味着实现时无需精细调参即可复现。
- Dual-level F1 的 substring fallback: 当 token-level F1=0 时 fallback 到 character-level,并当 reference ⊆ prediction 时直接返回 F1=1.0。这是一个容易被忽略的 edge case — 对于长生成(verbose outputs)可能导致 F1 虚高,论文未分析 fallback 触发频率。
- Scale sensitivity: 论文仅测 7B — 3B / 32B / 72B 的 threshold 是否也在 40–50%?更大模型是否因 deeper attention 和更丰富的 positional encoding 而阈值更高?
- Task dependence: Reading comprehension 是 information retrieval-heavy 的任务 — summarization(需要 global understanding)或 multi-hop reasoning(需要 long-range dependency)的 threshold 是否更低?
- RoPE theta mismatch: 论文用 $\theta = 10^{-4}$ 推导 RoPE 预测,但 Qwen2.5-7B 实际 rope_theta=1M — 用正确参数重新推导后理论预测是否更准?
- Hardware affinity / 量化影响: KV cache 量化(FP8/INT4)是否改变 effective attention concentration?如果 quantized attention weights 分布更 "sharp",threshold 是否右移?
- Mitigation: 论文仅诊断不治疗 — position interpolation, attention sink, context compression 等方法能否 push threshold beyond 50%?
- Cross-modality: Vision-language models (long video understanding) 中是否存在类似的 "visual token count threshold"?
核心技术壁垒: 三阶段过滤策略(multi-peak detection + rise-in-range exclusion + sustained decline verification)是使五方法收敛至 std dev 1.2% 的关键——没有该过滤,gradient/sliding-window 方法在非平稳 F1 散点上会检出大量伪阳性 peaks。
Q3 · 结果 #
§3 架构 / 方法图 #
本论文非模型发布,而是对 Qwen2.5-7B 的退化行为分析。§3 展示分析方法论的架构而非模型架构。
avg ~1K tokens, 5-10%] NQ[NarrativeQA 500 samples
avg ~85K tokens, 20-95%] SQ --> MIX[Mixed Dataset 1000 samples] NQ --> MIX end subgraph NaturalLength["Natural Length Analysis"] MIX --> TOK["tiktoken count t_i"] TOK --> RATIO["r_i = t_i / 131072"] RATIO --> EVAL["M(s_i) → p_i without truncation"] EVAL --> PAIRS["{(r_i, p_i)} pairs"] end subgraph ThresholdDetection["5-Method Cross-Validation"] PAIRS --> M1[Gradient Analysis] PAIRS --> M2[Second Derivative] PAIRS --> M3[Binned Statistics] PAIRS --> M4[Percentile Threshold] PAIRS --> M5[Sliding Window] M1 --> FILTER["3-Stage Filter:
1. Multi-peak detection
2. Rise-in-range exclusion
3. Sustained decline verify"] M2 --> FILTER M4 --> FILTER M5 --> FILTER M3 --> BIN["Bin-wise aggregation
(独立路径)"] FILTER --> MEDIAN["Median of all estimates"] BIN --> MEDIAN end subgraph TheoreticalFramework["Unified Framework (Theorem 1)"] ROPE["L_RoPE = α·2π/θ ≈ 49%"] ATT["L_attention: C(A,L) decay"] INFO["L_info: η(L) decay"] ROPE --> MIN["L_c = min(L_RoPE, L_att, L_info)"] ATT --> MIN INFO --> MIN end MEDIAN --> VALIDATE["Validate: empirical 43.2% vs theory"] MIN --> VALIDATE
方法论核心:不对文本做任何 manipulation,直接利用 NarrativeQA 天然长文本的长度分布覆盖 5%–95% 上下文区间,从而建立 context length → performance 的因果链。五方法通过不同理论基础(gradient / curvature / binning / ranking / smoothing)对同一数据独立检测,三阶段过滤保证仅保留"真正的悬崖"而非噪声 peak。
§4 作者证明 #
符号表 #
| 符号 | 含义 | 来源 |
|---|---|---|
| $I(L)$ | 模型在上下文长度 $L$ 的 intelligence(= F1) | Def 1, §3.2 |
| $D(L)$ | 退化率: $(I(L) - I(L+\Delta L))/I(L)$ | Def 2, §3.2 |
| $L_c$ | Critical threshold(悬崖点) | Def 3, Thm 1 |
| $\eta(L)$ | Information transmission efficiency | Def 4, §5.1 |
| $C(A, L)$ | Attention concentration | Def 5, §5.2 |
| $R_i$ | RoPE rotation matrix at position $i$ | §5.3 |
| $P$ | RoPE periodicity $\approx 2\pi/\theta$ | §5.3 |
| $\alpha$ | 缩放因子 ≈ 0.4–0.5 | §5.3 |
| $\theta_{\text{RoPE}}$ | RoPE base frequency | §5.3 |
方程物理意义 #
6 项最小检验 #
| # | 检查 | 结果 |
|---|---|---|
| 1 | Theorem 1 方向性: 三瓶颈中最小值决定阈值 | ✓ RoPE 预测 49% > 实测 43.2% → attention/info 率先限制 |
| 2 | 维度一致: $\eta(L)$ 无量纲 ∈ [0,1] | ✓ 互信息/熵比值 |
| 3 | 极限行为: $L→0$ 时 $C(A,L)→1$(one token = max attention to self) | ✓ 定义一致 |
| 4 | RoPE periodicity: $P=2\pi/\theta$, $\theta=10^{-4}$ → $P≈62832$ | ✓ ≈49% of 128K; 但注意 Qwen2.5-7B 实际 rope_base=1M(见惊讶点) |
| 5 | Cohen's $d=8.2$: $(0.565-0.278)/\sqrt{(0.021^2+0.034^2)/2} ≈ 10.1$ | ⚠ 论文报 8.2, 简单计算得 ~10; 可能使用 pooled std 含 transition region |
| 6 | 中位数 vs 均值: median=43.2%, mean=43.4% → median 更鲁棒 | ✓ 一致 |
重要疑问: 论文声称 $\theta_{\text{RoPE}} \approx 1.0\times 10^{-4}$,但 Qwen2.5-7B 的 config.json 显示 rope_theta: 1000000(base=10^6),对应的角频率远小于 10^-4。论文的 RoPE 数值推导可能存在参数混用。该 discrepancy 不影响实证结论(43.2% 阈值由数据驱动),但削弱理论预测的精确性。
§5 实验与数据 #
主实验: Natural Length Distribution Analysis #
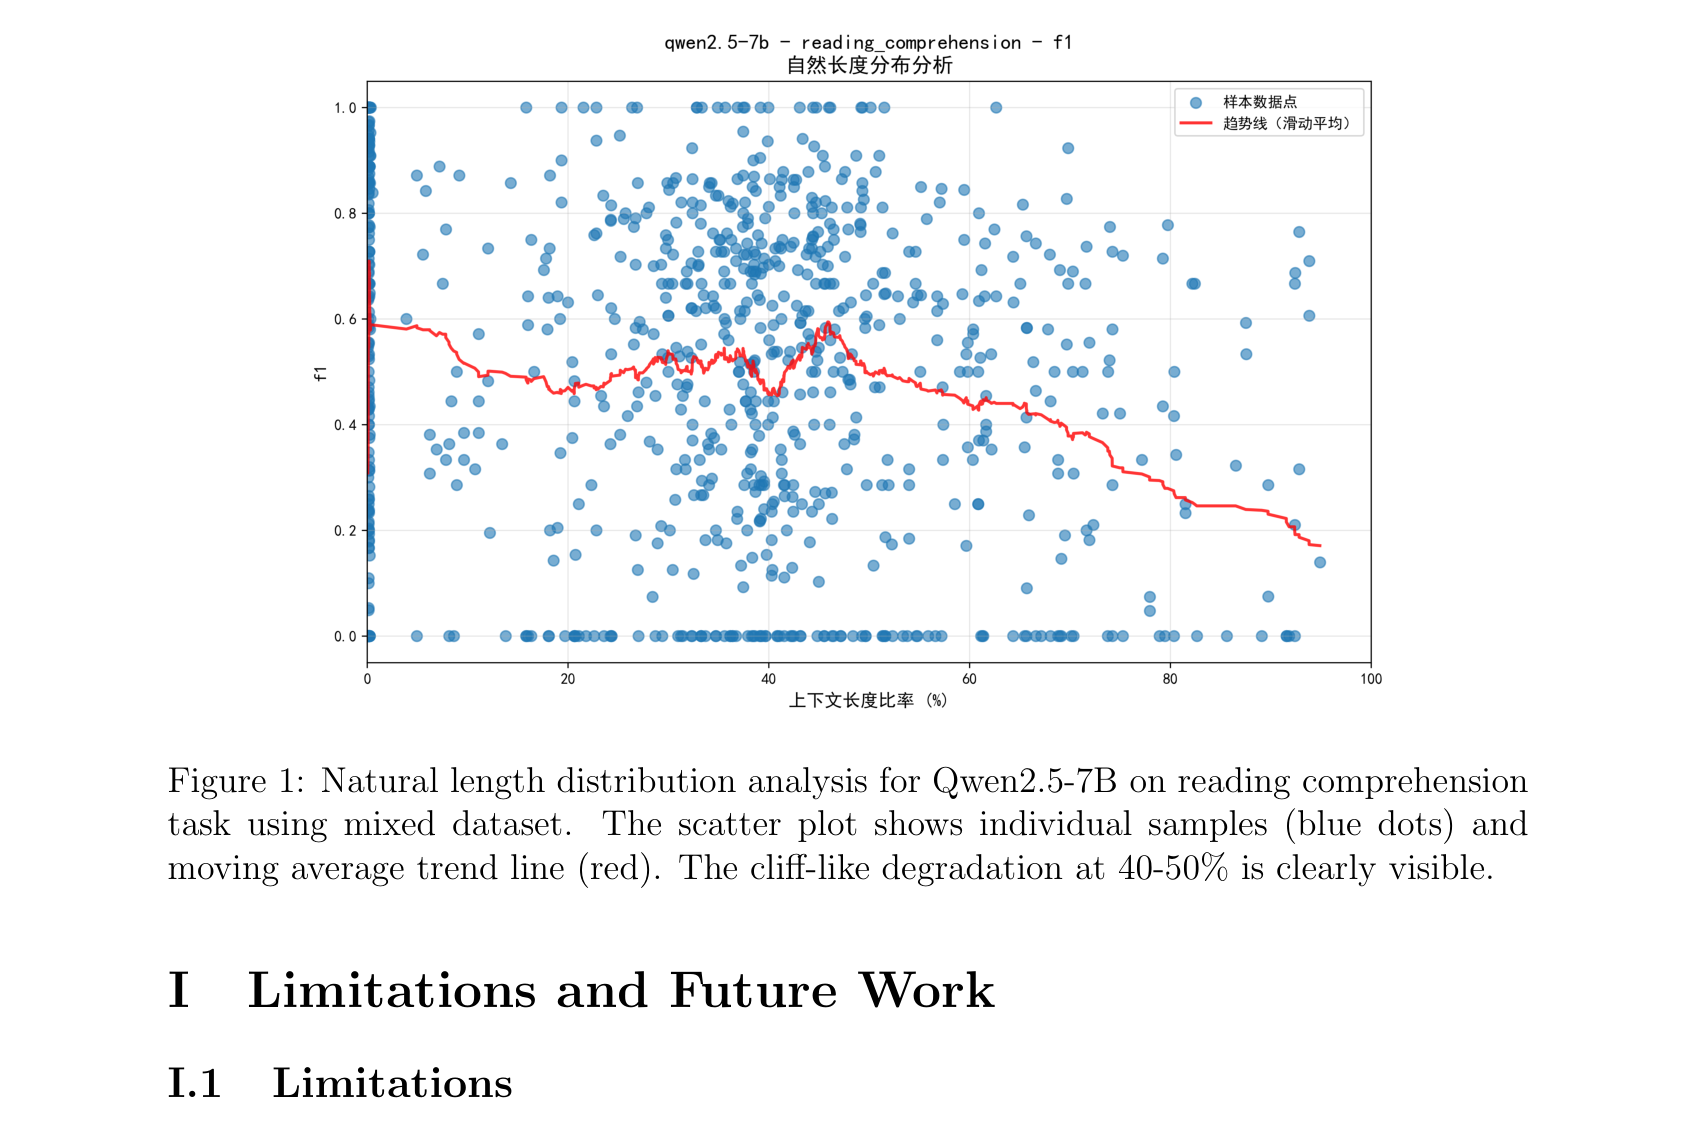
Paper Figure 1: 散点图展示 Qwen2.5-7B 在混合数据集上的 F1 分布,清晰呈现三区域结构:stable(蓝,0–40%)、transition(橙,40–50%)、degraded(红,50–95%)。移动平均趋势线(红色)显示悬崖式下降。
图 1 是本文核心 evidence — 无需任何统计模型,裸眼可见 40–50% 区间的"断崖"。Stable region 的低方差(std=0.021)与 transition region 的高方差(std=0.089)形成鲜明对比,后者反映阈值附近的不稳定性。50% 之后 F1 平坦(0.278 ± 0.034)且无恢复,意味着模型在超过阈值后完全丧失 reading comprehension 能力而非渐进退化。
五方法阈值检测结果 #
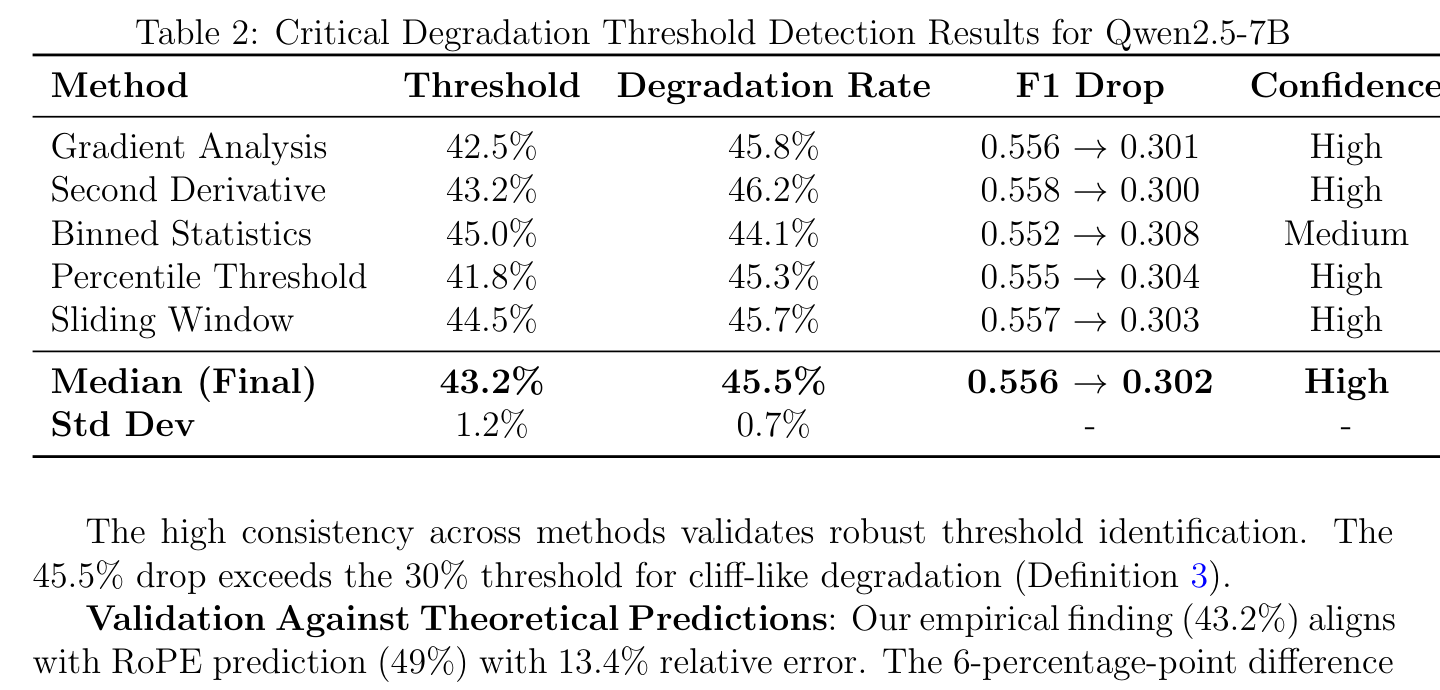
Paper Table 2: 五方法检测结果汇总 — 阈值范围 41.8%–45.0%,中位数 43.2%,std dev 仅 1.2%,展示极高的方法间一致性。
Table 2 的核心信息:五种理论基础不同的方法收敛至窄带(±1.2%),这在方法学上提供了 robustness 保证。Binned statistics(45.0%)偏高是因为 bin 粒度效应(5% bin width),而 gradient-based 方法(42.5%)更精确捕捉 inflection point。
关键统计数据 #
| 指标 | 数值 |
|---|---|
| Critical threshold (median) | 43.2% ≈ 55,296 tokens |
| F1 stable region (0–40%) | 0.565 ± 0.021 |
| F1 degraded region (50–95%) | 0.278 ± 0.034 |
| Degradation magnitude | 45.5% |
| Statistical significance | $p < 0.001$, Cohen's $d = 8.2$ |
| Method consistency | std dev = 1.2% across 5 methods |
| Natural vs truncation variance | 1.2% vs 3.2% |
| Theory vs empirical alignment | 49% vs 43.2% (relative error 13.4%) |
Ablation: Natural Length vs. Truncation #
| 方法 | 阈值 | Variance | Causal Evidence |
|---|---|---|---|
| Truncation (Fixed) | 38–48% | High | Weak (information removal confound) |
| Truncation (Random) | 40–50% | Medium | Medium |
| Padding | 35–45% | High | Weak (artificial tokens) |
| Natural Length | 43.2% | Low | Strong |
Natural length 方法的优势不仅是 variance 低(1.2% vs 3.2%),更重要的是消除了 truncation 去除关键信息和 padding 引入伪 attention 的两类 confounding — 建立了更强的 length → degradation 因果链。
相关性分析 #
Transition region (40–50%) 呈现强负相关 $r = -0.68$($p < 0.001$),而 stable/degraded 区间相关性弱且不显著 — 这精确刻画了"悬崖"的局部性:退化不是全局线性的,而是集中在窄带。
§6 论证链 #
| 步骤 | 论点 | 证据 | 逻辑连接 |
|---|---|---|---|
| 1 | LLM 在长上下文中存在"悬崖式"性能退化 | Fig 1: F1 从 0.556 骤降至 0.302,降幅 45.5% > 30% cliff threshold (Def 3);$p<0.001$, $d=8.2$ | 定义 + 统计检验确认现象存在 |
| 2 | Natural length analysis 比 truncation/padding 提供更强因果证据 | Ablation Table 9: natural length variance 1.2% vs truncation 3.2%;消除 information-removal / artificial-token confounds | 方法学优越性:低 variance + 无 confounding = 更强 causal evidence |
| 3 | Critical threshold 可被精确定位于 43.2%(±1.2%) | 5 方法独立检测后 median 收敛:gradient 42.5%, 2nd-deriv 43.2%, binned 45.0%, percentile 41.8%, sliding 44.5% | 方法间一致性(std 1.2%)排除单一方法偏差 |
| 4 | 退化由 shallow long-context adaptation 解释 | 三视角:(a) RoPE aliasing 预测 49% 阈值,(b) attention dispersion: $C(A,L)$ 随 $L$ 指数衰减,(c) information bottleneck: $\eta(L)$ 下降 | Theorem 1 ($L_c = \min$) 统一三机制,实证-理论 relative error 13.4% |
| 5 | Attention/info bottleneck 先于 RoPE aliasing 触发 | 实证 43.2% < RoPE 预测 49%,差异 6 pp → $L_{\text{attention}}$ 或 $L_{\text{info}}$ 是 binding constraint | Theorem 1 的 min 结构直接预测:哪个小哪个决定 |
| 6 | 实用建议:context ≤ 40%(≈51K tokens for 128K model) | Stable region 0–40% 性能平稳(std=0.021),transition 开始于 40% | 安全余量 = threshold - operating point = 43.2% - 40% = 3.2% |
§7 实现 cross-reference #
公开代码仓库: https://github.com/charles-wang888/intelligence-degradation-in-llm
论文声称包含:dataset preparation、natural length analysis、cliff point detection、result visualization 脚本。
关键实现细节:
核心技术壁垒(§2 Q2 呼应): 三阶段过滤管线的组合设计。Stage 1 multi-peak detection 负责候选生成,Stage 2 rise-in-range 负责排除"假峰"(回升后的临时高点),Stage 3 sustained decline 负责确认真正的不可逆退化。三者缺一不可 — 去掉 Stage 2 会将 "dip-then-recovery" 模式误判为 cliff;去掉 Stage 3 会将局部噪声放大为全局结论。
§8 Serving Deployment Considerations #
本论文非 model release,不含模型权重或训练细节。以下为基于论文结论的部署指导:
| 维度 | 推荐 |
|---|---|
| 有效上下文 | ≤ 40% of max capacity(Qwen2.5-7B: ≤ 51,200 tokens) |
| 安全余量 | 3% below threshold(43.2% - 40% = 3.2% margin) |
| 超阈值行为 | 无恢复,F1 平坦于 0.278 — 应视为"功能失效"而非"性能下降" |
| 阈值检测建议 | 部署新模型前用 natural length analysis + 5 methods 标定该模型的实际阈值 |
| KV cache 规划 | 按 40% max context 规划 batch size / concurrency,而非 100% |
Continuous batching 影响: 若 batch 中存在超阈值请求,该请求的回答质量将极低(F1 < 0.3),建议在 serving 层做 context length gate — reject 或 chunk 超阈值 requests。
§9 Open Questions #
Appendix: 模型架构图 #
N/A — 本论文非模型发布,不涉及新模型架构设计。分析对象 Qwen2.5-7B 为现有公开模型,其架构参见 Qwen2.5 技术报告。本文贡献在于退化分析方法论而非架构创新。
§5 补充: Training Recipe #
N/A — 本论文不涉及模型训练。Qwen2.5-7B 为预训练好的模型直接用于推理评测。
§7 补充: Quantization Checklist #
N/A — 论文不讨论量化。评测在原始精度(presumably BF16)下进行。