MARLIN: Multi-Agent Game-Theoretic Reinforcement Learning for Sustainable LLM Inference in Cloud Datacenters
MARLIN: Multi-Agent Game-Theoretic RL for Sustainable LLM Inference — L2 #
§1 TL;DR #
MARLIN is a two-phase game-theoretic multi-agent RL framework that schedules LLM inference requests across geo-distributed datacenters, jointly optimizing TTFT, carbon emissions, water usage, and energy costs. Four parallel SAC agents each propose single-objective scheduling plans; a capital-modulated consensus mechanism blends them via utility voting, SGD refinement, and IR-based veto into Pareto-optimal schedules. Achieves ≥18% TTFT, ≥33% carbon, ≥43% water, ≥11% cost reductions vs. SOTA; PHV 46%+ above next-best baseline.
§2 痛点 / 方法 / 结果 #
Q1 — 痛点 #
LLM inference accounts for 90% of lifecycle energy, dwarfing training costs. At scale the footprint is staggering: GPT-4o inference alone emits more carbon than 30,000 cars per year and consumes enough water for 500+ Olympic pools annually. US datacenters consumed 183 TWh in 2024, projected to reach 426 TWh by 2030.
Existing LLM inference schedulers split into two camps — performance-focused (Helix, Splitwise, PerLLM) and sustainability-focused (SLIT) — but none co-optimizes all four metrics (TTFT, carbon, water, cost) across geo-distributed datacenters. The multi-objective nature creates inherent tension: routing to the nearest datacenter minimizes latency but may maximize carbon if that DC draws from a coal-heavy grid.
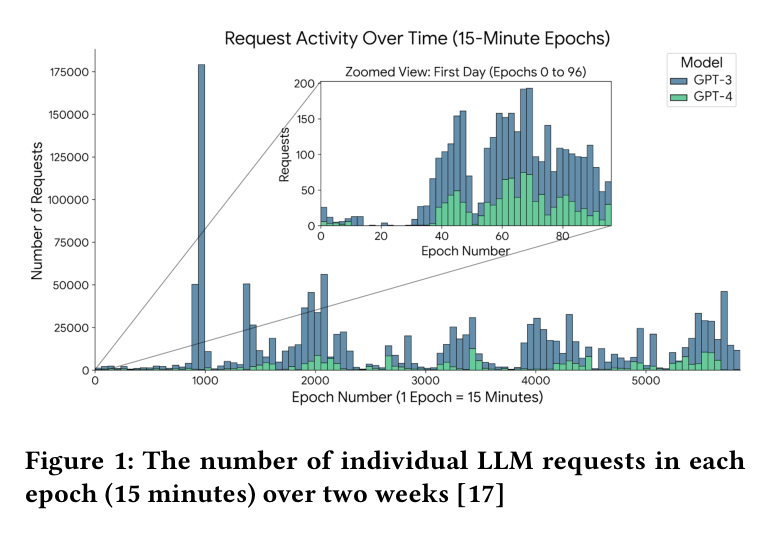
Paper's Figure 1, verbatim (caption: "The number of individual LLM requests in each epoch (15 minutes) over two weeks").
The real-world trace reveals extreme burstiness — spikes of 175,000 requests per 15-minute epoch interspersed with near-zero valleys — making static allocation policies fundamentally inadequate. Inset shows diurnal patterns within the first day.
Q2 — 方法 #
Two-phase competitive game framework:
- Phase 1 (Agent Training): Four parallel soft actor-critic (SAC) agents, each assigned one objective ($LA_{tot}$, $Z_{tot}$, $G_{tot}$, $Cost_{tot}$), independently generate scheduling proposals. Each agent's actor MLP is augmented with a FiLM (feature-wise linear modulation) layer that integrates workload forecasts and datacenter attributes as conditioning inputs. Hindsight experience replay (HER) relabels past experiences for cross-epoch learning. Reward: $r_j = EMA + ECO + metric_j - penalty$, where $penalty$ grows when TTFT exceeds SLA and $ECO$ incentivizes node consolidation.
- Phase 2 (Consensus): All proposals enter a game-theoretic negotiation:
- Utility-weighted blending — each agent's proposal weighted by utility score $q_j$.
- SGD refinement — 5 gradient steps on $Q_{tot} = \text{mean}(Q_1, \ldots, Q_J)$.
- IR-based veto — any agent whose utility loss exceeds $\delta_{thresh}$ and has capital $C_j > C_{thresh}$ pulls the blend toward its own proposal.
- Capital update — performance and bonus scores update each agent's influence via bounded EMA.
- Workload predictor: Regression-based EWMA forecaster achieving >90% accuracy at ~100μs per prediction.
Multi-objective formulation:
$$\min \sum_{e}^{E} (w_1 LA_{tot,e} + w_2 Z_{tot,e} + w_3 G_{tot,e} + w_4 Cost_{tot,e}) \quad \text{s.t.} \; M_{n,e} \leq M_{tot,n}, \; LA_{tot,e} \leq LA, \; \sum w_j = 1$$
核心技术壁垒 — Phase 2 capital-modulated consensus. The game-theoretic blending of independently trained single-objective proposals is what produces superior Pareto fronts. Ablation confirms removing Phase 2 drops PHV by 66.5%, far exceeding any other component. The key insight: competitive negotiation with evolving capital creates better multi-objective trade-offs than joint training or scalarized reward, because each agent fully exploits its objective's signal before negotiation forces compromise.
Q3 — 结果 #
| Metric | MARLIN best variant | vs. best RL baseline | vs. SLIT (best heuristic) |
|---|---|---|---|
| TTFT | MinLatency ~0.75 s | ≥18.67% (vs. QLearning) | 2.29% (Balanced) |
| Carbon | MinCarbon ~3,000 kg | ≥33.61% (vs. QLearning) | 61.07% (Balanced) |
| Water | MinWater ~1,000 L | ≥43.88% (vs. DDQN) | 81.11% (Balanced) |
| Cost | MinCost ~$2,200 | ≥11.72% (vs. ActorCritic) | 60.90% (Balanced) |
| PHV | 1.1251 | +46.4% (vs. DDQN 0.7681) | +149.5% (vs. SLIT 0.4511) |
Scales from 4→12 DCs: MARLIN-Balanced at 12 DCs vs. SLIT achieves 4.66% latency, 65.22% carbon, 81.7% water, 56.59% cost reductions. Key caveat: MARLIN-Balanced trades up to 23.61% TTFT increase vs. QLearning — significant for SLA-sensitive deployments.
§3 架构 / 方法图 #
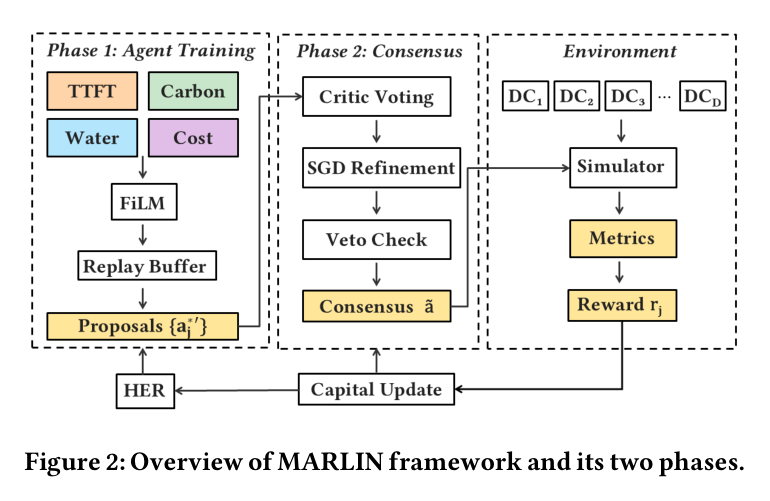
Paper's Figure 2, verbatim (caption: "Overview of MARLIN framework and its two phases").
The architecture has three panels. Left (Phase 1): four colored input streams (TTFT, Carbon, Water, Cost) feed into independent SAC agents with FiLM modulation and replay buffers, producing per-objective proposals. Center (Phase 2): proposals enter critic voting → SGD refinement → veto check → consensus plan $\tilde{a}$. Right (Environment): geo-distributed DC simulator returns per-metric rewards feeding back into capital update and HER for the next epoch.
System scope: Multi-region (8 globally distributed DCs), each with 1,000 nodes across 6 types (2/4/8× NVIDIA A100 or H100 GPUs on Xeon servers). Hot/cold aisle air cooling. Inference-only workload (GPT-3/4 class via Llama-7B/70B execution profiles). Network model accounts for propagation delay ($dist \times \lambda_{media}$) and inter-DC hop latency but does not model intra-DC fabric or collective communication — MARLIN operates at the inter-DC request routing level, above container orchestrators like Kubernetes or vLLM.
§4 作者证明 #
记号表 #
| Symbol | Definition | Unit |
|---|---|---|
| $MF_\upsilon$ | Memory footprint of model $\upsilon$ weights | bytes |
| $KV_{\upsilon,i,\tau}$ | KV cache for model $\upsilon$, request $i$, token $\tau$ | bytes |
| $M_{n,e}$ | Total GPU memory usage on node $n$ at epoch $e$ | bytes |
| $LA_{tot,e}$ | Total TTFT across all requests in epoch $e$ | seconds |
| $Z_{tot,e}$ | Total carbon emissions in epoch $e$ | kg CO₂ |
| $G_{tot,e}$ | Total water usage in epoch $e$ | liters |
| $Cost_{tot,e}$ | Total energy cost in epoch $e$ | USD |
| $E_{IT,n,e}$ | IT energy of node $n$ in epoch $e$ | joules |
| $CI_{d,e}$ | Carbon intensity at DC $d$, epoch $e$ | kg CO₂/kWh |
| $GI_d$ | Water intensity of electricity generation at DC $d$ | L/kWh |
| $TOU_{d,e}$ | Time-of-use electricity price at DC $d$, epoch $e$ | $/kWh |
| $COP_d$ | Coefficient of performance of cooling at DC $d$ | dimensionless |
| $C_j$ | Capital (influence weight) of agent $j$ | dimensionless |
| $\tilde{a}$ | Final blended consensus scheduling plan | assignment vector |
| $w_{1..4}$ | Objective weights | dimensionless, $\sum = 1$ |
| $\Gamma$ | Weighted resource-allocation game | — |
方程物理意义 #
Memory constraint (Eq. 1): $M_{n,e} = \sum_\upsilon MF_\upsilon + \sum_i \sum_\tau KV_{\upsilon,i,\tau}$ — total GPU memory is shared model weights plus per-request KV cache growing linearly with token count. Exceeding $M_{tot,n}$ forces queueing until prior requests release cache.
TTFT decomposition (Eq. 4): $LA_{tot,e} = \sum_i (LA_{load,i} + 2 \times LA_{net,i} + LA_{tot,exec,i}/T_i)$ — three per-request components: weight loading (amortizable if model already resident), round-trip network delay (doubled for request+response), per-token execution time (memory-bandwidth-bound).
Energy hierarchy: $E_{tot} = E_{IT} + 3 \times E_{IT}/COP + 0.13 \times E_{IT}$ — implied PUE = $1 + 3/COP + 0.13$. At COP = 5 this gives PUE ≈ 1.73, reasonable for conventional air cooling.
Water feedback loop: $Z_{G,d,e} = (Z_{pot} + Z_{waste}) \times CI_{d,e}$ — water treatment consumes electricity whose carbon cost depends on local grid mix. Dirty grids amplify water-associated carbon, creating a compounding effect that makes geo-routing decisions non-trivial.
Consensus game: $\tilde{a}, [C_j] = \Gamma([a_j, \delta_j, C_j, Q_j])$ — maps per-agent proposals to a blended plan plus updated capitals. Individual rationality (IR) via the veto mechanism guarantees no agent accepts a consensus worse than its standalone proposal by more than $\delta_{thresh}$.
6 checks #
- Dimensional consistency: $E_{IT,n,e} = PC_{pstate} \times TDP_n \times t_e$ → (dimensionless × W × s) = J ✓
- Boundary — uniform intensities: If all DCs have identical CI, GI, TOU, the optimization collapses to latency-only. Consistent with MARLIN-MinLatency dominance in homogeneous settings. ✓
- Conservation — PUE range: At COP = 5, PUE ≈ 1.73; at COP = 3, PUE ≈ 2.13. Both within industry range (1.5–2.5 for air-cooled DCs). ✓
- Monotonicity: $LA_{net,i} = dist \times \lambda_{media} + R_{s,d} \times \sigma_{hop}$ increases monotonically with distance and hops → routing to farther DCs always costs latency. ✓
- Reward sign: $penalty$ grows with SLA violation → gradient pushes away from violations; $ECO$ bonus rewards consolidation → fewer active nodes, lower idle power. ✓
- Weight constraint: $\sum w_j = 1, w_j \geq 0$ → convex combination bounds the blended objective between individual metric extremes. ✓
- Dual replay buffer with 30/70 cross-epoch sampling. The buffer holds 20,000 current-epoch and 5,000 historical-epoch transitions, sampled at a 30/70 ratio. Without this split (no-dual-buffer), PHV drops 33.9%. The HER relabeling on cross-epoch samples enables agents to learn from scheduling decisions made under different workload regimes, critical given the extreme burstiness in the trace (Fig. 1).
- ECO consolidation bonus in reward. This term incentivizes packing requests onto fewer active nodes, reducing idle power ($PC_{pstate} \times TDP$ even at lowest performance state). Not ablated independently but embedded in the reward function $r_j = EMA + ECO + metric_j - penalty$ — likely a meaningful contributor to cost and carbon metrics since idle node power is non-trivial at datacenter scale.
Scaling (cluster-specific): Phase 1 runtime $O(K_{opt} \times |\theta_j|)$ is independent of DC count $D$ (agents train in parallel on fixed-size state). Phase 2 memory $O(J \times |\theta_j| + J \times D)$ grows linearly with $D$. Empirically verified: MARLIN scales smoothly 4→12 DCs (Fig. 5) while heuristics stagnate and Splitwise degrades.
§5 实验与数据 #
SOTA comparison (8 DCs, 24h simulation) #
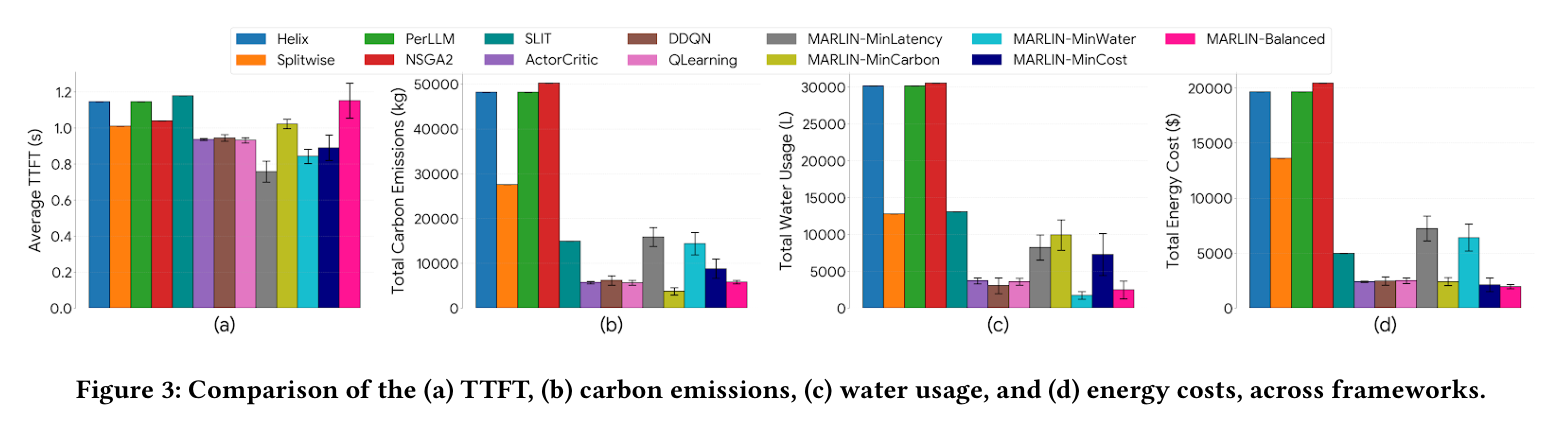
Paper's Figure 3, verbatim (caption: "Comparison of the (a) TTFT, (b) carbon emissions, (c) water usage, and (d) energy costs, across frameworks").
Four-panel grouped bar chart comparing 13 frameworks. The separation is stark: heuristic methods (Helix, PerLLM, NSGA-II) cluster at the worst end on all four metrics. Splitwise and SLIT sit in the middle. RL baselines (QLearning, DDQN, ActorCritic) are competitive but uniformly dominated by MARLIN variants. MARLIN-MinCarbon achieves ~3,000 kg carbon (vs. ~47,000+ for heuristics), while MARLIN-MinWater reaches ~1,000 L (vs. ~30,000 for heuristics). Even MARLIN-Balanced, which compromises across all objectives, beats every heuristic on carbon/water/cost.
Pareto hypervolume #
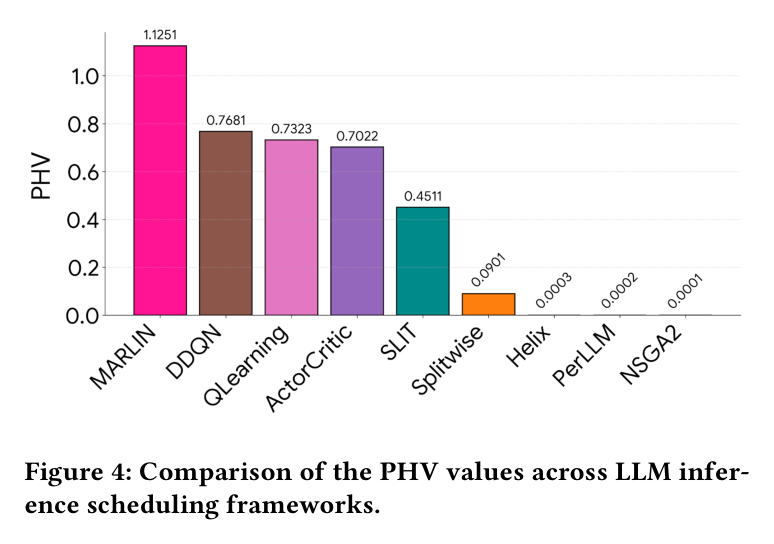
Paper's Figure 4, verbatim (caption: "Comparison of the PHV values across LLM inference scheduling frameworks").
MARLIN's 4D Pareto hypervolume (1.1251) is 46.4% higher than next-best DDQN (0.7681) and roughly three orders of magnitude above heuristic methods (NSGA-II = 0.0001). The gap reflects MARLIN's ability to produce a diverse 40-point Pareto front vs. single-point heuristic solutions. SLIT covers only 40.09% of MARLIN's hypervolume despite being the only other sustainability-aware framework.
Scalability (4→12 DCs) #
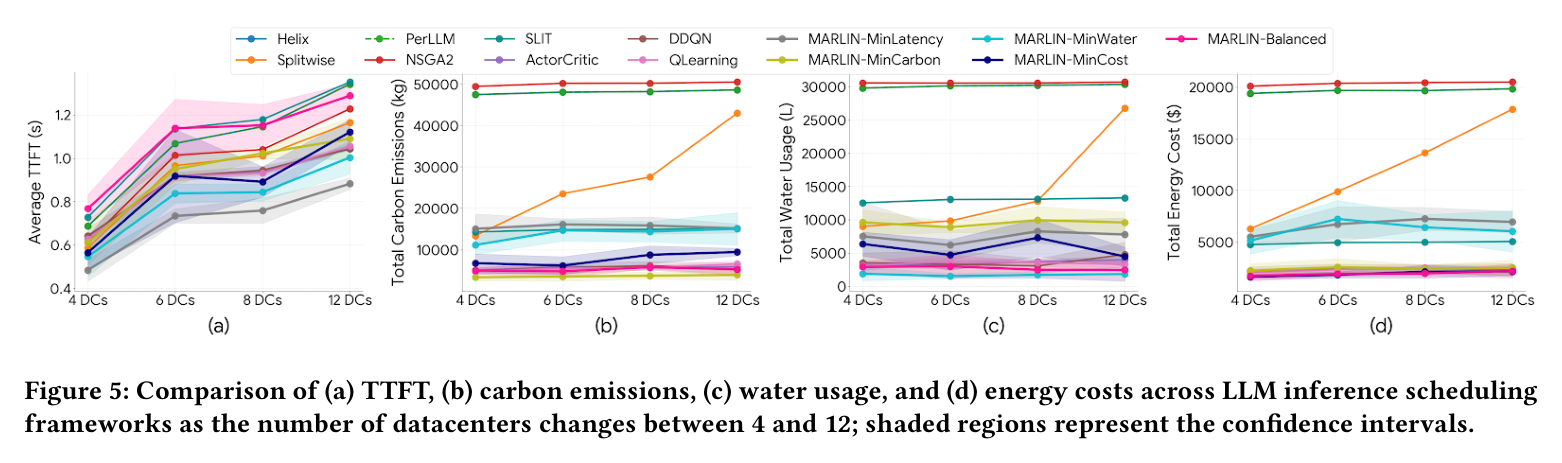
Paper's Figure 5, verbatim (caption: "Comparison of (a) TTFT, (b) carbon emissions, (c) water usage, and (d) energy costs across LLM inference scheduling frameworks as the number of datacenters changes between 4 and 12").
Heuristic approaches (Helix, PerLLM, NSGA-II) remain flat across DC counts — they cannot exploit additional geographic diversity. Splitwise degrades dramatically (carbon rises from ~15,000 to >42,000 kg at 12 DCs). MARLIN variants maintain or improve, with MARLIN-Balanced reducing water by an average of 16.4% at larger scales by leveraging each DC's unique sustainability fingerprint.
Unexpected finding: MARLIN-MinCarbon outperforms MARLIN-MinCost on the cost metric at 12 DCs. Low-carbon energy sources (wind, solar) tend to be cheap, and the carbon signal is sharper, allowing MinCarbon to discover cheap+clean DCs faster than MinCost discovers cheap-but-possibly-dirty ones.
Ablation #
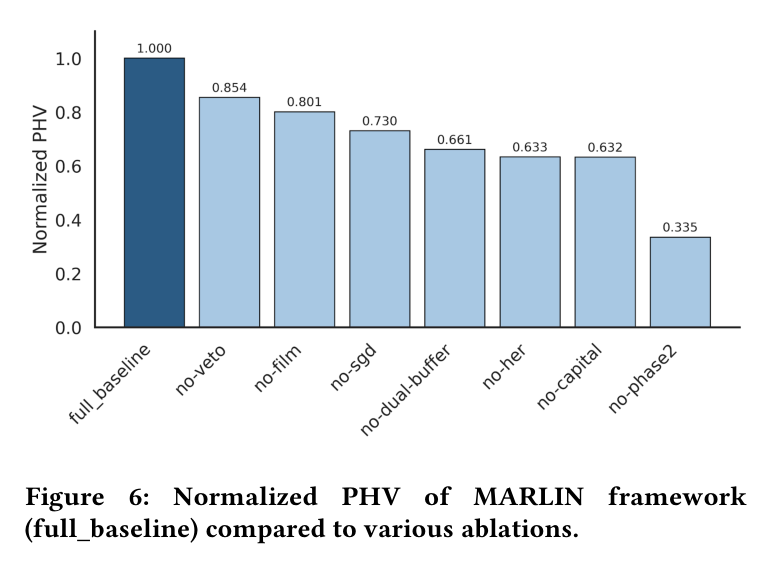
Paper's Figure 6, verbatim (caption: "Normalized PHV of MARLIN framework (full_baseline) compared to various ablations").
| Ablation | Normalized PHV | Drop |
|---|---|---|
| full_baseline | 1.000 | — |
| no-veto | 0.854 | −14.6% |
| no-film | 0.801 | −19.9% |
| no-sgd | 0.730 | −27.0% |
| no-dual-buffer | 0.661 | −33.9% |
| no-her | 0.633 | −36.7% |
| no-capital | 0.632 | −36.8% |
| no-phase2 | 0.335 | −66.5% |
Phase 2 consensus is overwhelmingly the most critical component. Capital tracking and HER have nearly identical impact (~37%), suggesting long-term influence dynamics and cross-epoch learning contribute comparably to solution diversity. The veto mechanism — despite being the most theoretically motivated (IR theory, Von Neumann & Morgenstern 1947) — has the smallest impact at 14.6%. Theory-heaviness does not predict empirical importance.
Hyperparameters: Actor LR = 0.0003, critic LR = 0.001, γ = 0.95, τ = 0.005. Actor hidden dim 128, critic hidden dim 256. Replay buffer: 20,000 current-epoch + 5,000 cross-epoch samples, 30/70 sampling split. SGD: LR = 0.05, 5 steps. Veto: 150 capital threshold, 0.5 pull strength. Max DC utilization 95%.
§6 论证链 #
| Step | Claim | Evidence | Depends on |
|---|---|---|---|
| 1 | LLM inference dominates lifecycle energy (90%) and creates unsustainable carbon/water footprint | Literature: Jegham 2025, Leppert 2026 | — |
| 2 | Geo-distributed DCs have heterogeneous, time-varying carbon/water/cost intensities | Analytical models §3.3–3.5 with real CI/GI/TOU data | 1 |
| 3 | Multi-objective scheduling across DCs can exploit heterogeneity to jointly reduce TTFT + carbon + water + cost | Optimization formulation §4: weighted sum under memory/SLA constraints | 2 |
| 4 | Independent single-objective RL agents produce high-quality per-metric proposals | Each MARLIN single-metric variant beats all 8 baselines on its target (Fig. 3) | 3 |
| 5 | Game-theoretic consensus blends proposals into Pareto-superior schedules | PHV = 1.1251 vs. 0.7681 (Fig. 4); Phase 2 removal → −66.5% PHV (Fig. 6) | 4 |
| 6 | Framework scales to larger DC networks while baselines degrade | 4→12 DCs: MARLIN improves; Splitwise degrades; heuristics stagnate (Fig. 5) | 5 |
§7 实现 cross-reference #
[实现未公开] — The paper implements a Python simulator for all models (§3) and algorithms (§5) but does not release source code or training artifacts. All experiments run in simulation; real-world geo-distributed deployment validation is absent. MARLIN is positioned as a meta-scheduler above container orchestrators (Kubernetes, vLLM).
核心技术壁垒实装 #
Phase 2 consensus requires: (1) per-agent critic networks $Q_j$ for utility estimation during blending, (2) SGD with projection onto the feasible assignment set (5 steps, LR = 0.05), (3) capital tracking via bounded EMA with growth rate $\eta$ and scaling factor $\beta$, (4) veto logic gated on $C_j > 150$ and utility loss $> \delta_{thresh}$ with 0.5 pull strength.