HBF Sucks? A Full-Stack Characterization of High-Bandwidth Flash for KV-Centric LLM Serving
HBF Sucks? A Full-Stack Characterization of High-Bandwidth Flash for KV-Centric LLM Serving #
1. TL;DR #
Dropping High-Bandwidth Flash (HBF) in as an SSD replacement under an unchanged Mooncake KV-pooling runtime makes serving 2–5.5× slower (SLO goodput down 1.1–2.7×). A cost model shows why: the far tier sits on ~1% of the critical path, gets a write-heavy ($\rho<1$) cold stream, and thermally throttles at 202 GB/s. Faster media barely matters; losing near-tier capacity dominates.
2. 痛点 / 方法 / 结果 (Q1 / Q2 / Q3) #
Q1 — 痛点 (the problem) #
KV cache grows with context length, batch size, and concurrent requests, exceeding GPU memory. The standard fix is to offload reusable KV into a larger tier (Mooncake: CPU DRAM → SSD → network). HBF promises flash-scale capacity behind a wide package-local interface with ~10× lower read latency than an SSD. The "obvious" upgrade is to keep the SSD-style stack and swap HBF underneath. The paper's motivating anomaly: a strictly faster storage device produces a strictly slower system, and nobody has measured why under a real production runtime.
Q2 — 方法 (the method) #
Rather than propose a new framework, this paper builds a falsification harness around the drop-in deployment:
- A cost–benefit model (Eq. 6) decomposing HBF's net latency change into one benefit term ($f\,\Delta t_{\text{media}}$) and four subtracted cost terms ($C_{\text{move}}, C_{\text{pkg}}, C_{\text{var}}, C_{\text{life}}$), yielding three necessary conditions:
- C1 — the exposed secondary-tier I/O fraction $f$ must be large;
- C2 — useful reads per byte written $\rho$ must exceed break-even $\rho^{\star}=AC/S$;
- C3 — delivered bandwidth must sustain near the datasheet peak.
- Full-stack simulation: an extended TokenSim modeling continuous batching, paged KV, admission/preemption, Mooncake-style hashed 16-token lookup, per-tier read/write byte counters, and HBF-1/HBF-2 roadmap organizations — driven by four complete 2-hour Qwen-Bailian production traces, five dense/MoE models, and H100/B200 profiles.
- Physical models: a 3D-ICE thermal model of a 16-Hi TLC stack and a write-endurance budget, both driven by the same 16-token access energy.
- Stage coverage: both prefill (materializes KV, writes new blocks after prefix-filter) and decode (reads retained KV history); the runtime does not fuse them.
- Serving, continuous batching. Admission, retention, lookup, and KV save/restore are the unmodified Mooncake-style policy — only the backing tier and transport change.
- Parallelism: TP=8, PP=DP=1, expert parallelism for MoE. The framework owns KV placement across the near/far hierarchy; it delegates compute parallelism to the model executor.
- Deployment mode: single-node 8-GPU with a shared secondary tier (SSD, or HBF-1/HBF-2 package-local flash).
- Dimensional consistency: Eq. (6) is in latency units; $f$ is dimensionless, $\Delta t_{\text{media}}$ is time, each $C$ is a latency-equivalent cost. Consistent. ✔
- Boundary $k\to\infty$: Eq. (7) → $\Delta T/T = f$. A perfect medium recovers exactly the exposed fraction, no more. ✔
- Boundary $k=1$: Eq. (7) → $\Delta T/T=0$ (no media change, no effect). ✔
- First-order mapping to reported number: sweep gives $\Delta T/T = 0.75\%$ (HBF-1) at $k=3.75$; invert: $f = 0.0075/(1-1/3.75) = 0.0075/0.733 \approx 1.02\%$ — matches the paper's $f\approx1\%$. ✔
- Monotonicity / interior-vs-boundary: $\Delta_{\text{HBF}}$ is decreasing in $C_{\text{pkg}}$; with $f\approx0.01$ and $C_{\text{pkg}}$ measured 2 orders of magnitude larger than $f\Delta t_{\text{media}}$, the optimum is at the boundary "do not deploy" — no interior tuning point exists. ✔
- C2 plug-in: measured $\rho\in[0.20,0.88]$ (Table 8), all $<\rho^{\star}\gtrsim1$, so $\rho S < AC$ on every trace — the write is never repaid, consistent with the model's prediction. ✔
- Simulator base: TokenSim (arXiv:2503.08415), extended with Mooncake-style lookup, hashed 16-token KV identifiers, object save/load events, SSD + HBF tiers, per-tier read/write counters, HBF-1/HBF-2 profiles, connector-wait accounting, and SLO outputs (§4.1). Validated by regression checks on block/byte conservation, save/load ordering, deterministic replay, per-tier counters.
- Thermal model: 3D-ICE [23] over a 16-Hi TLC stack; access energy per 16-token block; 80 °C junction policy that closes hottest/highest-traffic planes and redirects writes (§4.4, §8.1).
- Endurance model: linear TBW exhaustion vs a 3-DWPD KIOXIA CM7-V reference (38.4 TB/day) and a favorable TLC budget (21.7 TB/day) (§4.4, §8.2).
- Baseline runtime of record: unmodified Mooncake SSD-offloading path (async, off the write critical path) [14, 20] — the object under test, held fixed while the backing tier changes.
- Host/device contract: taken verbatim from the OCP HBF base-die spec v0.7.0 [1] (AXI over UCIe, 64-byte reads, complete-4 KiB-page writes, page-zero-triggered block erase, host-managed wear leveling).
- The invertibility of Eq. (7) is the whole method: instead of instrumenting the simulator to directly attribute time to secondary-tier I/O (hard, overlap-sensitive), they sweep media latency $k=3.75\times$ and back out $f$ from the observed E2E delta. This sidesteps the hardest measurement problem in the paper.
- Equal random/sequential HBF bandwidth in the batching experiment (§7.2): they deliberately hold HBF's random and sequential bandwidth equal so batching can only help by amortizing fixed per-operation latency. This isolates why Mooncake bucketing — which on SSD attacks the random-access penalty too — collapses to 2.69% on HBF (bucket occupancy 94→4 blocks as block size grows, Fig. 9b).
- Serving stage: orchestration/placement layer over a KV-pooling runtime; touches both prefill (writes) and decode (reads).
- Concurrency regime: mid-to-high; the failure mode sharpens with load because near-tier capacity gates admission and HBF variants saturate at lower QPS (Fig. 5). At very low load HBF's slower access is simply exposed; at high load the queue collapses.
- Hardware affinity: H100 pairs sit at the severe end (2–5.5×), B200 at the mild end — B200's larger, faster near tier partly absorbs the package trade. HBF-1 (off-interposer GDDR7 near tier) is worse than HBF-2 (on-interposer HBM3e near tier) despite more flash.
- Ecosystem integration: the takeaway for a shop running vLLM+Mooncake on SSD today is do not swap the medium under the same policy. Adopting HBF beneficially requires a new placement policy (critical-path-aware access, reuse-aware admission, write budgeting, thermal coordination), not a config flag or library swap.
- Workload regime table (where it wins / loses):
- A base-die control plane (reuse tracking, write budgeting, thermal-aware placement) rather than a general attention engine — Finding 2 shows compute is the wrong lever; the silicon should manage which KV lands in flash.
- Object-aware channels: OCP's separate weight and KV channels (§13.3.3) point at hardware that lets the host physically segregate read-mostly (weights, shared prefixes) from write-heavy (transient KV) traffic, so the endurance/thermal budget is spent only on data that repays it.
- A thermal state exposed to the scheduler: delivered bandwidth is not a constant; the runtime needs a per-plane thermal/endurance signal as first-class scheduling input, not a single peak-bandwidth number.
- These conditions are device-agnostic ($f$, $\rho$, sustained BW), so the same argument shapes CXL-attached flash and other near-data NAND tiers, not only HBF.
核心技术壁垒 (THE single hardest-to-replicate insight): the paper cleanly separates media speed from the package tradeoff it forces. Every prior HBF study conflates "faster flash" with "the whole organization changed." By running a media-only sweep (vary HBF latency $k=3.75\times$, hold GPU organization fixed) alongside a complete-architecture comparison, they invert Eq. (7) to recover the exposed fraction $f\approx1\%$ directly from a serving measurement — proving the loss comes from the demoted near tier ($C_{\text{pkg}}$), not the medium. Reproducing this requires the invertibility trick plus a simulator instrumented for per-tier byte accounting under production replay.
Q3 — 结果 (the result) #
Across H100 and B200: average end-to-end latency rises 2–5.5×, delivered throughput falls 4–34%, maximum SLO goodput falls 1.1–2.7×. A $3.75\times$ media-latency improvement moves E2E latency <1%. Every trace is write-heavy at the flash tier ($\rho=0.20$–$0.88$, all below break-even). The stack thermally throttles at 202.27 GB/s / 53.72 W (far below the ~1.2 TB/s interface peak), and the TLC tier lasts a constant 0.56× the capacity-matched SSD pool's life on every trace. Verdict: the device is fine; the drop-in deployment is not.
3. 架构 / 方法图 (Architecture) #
System scope (framework pin-down) #
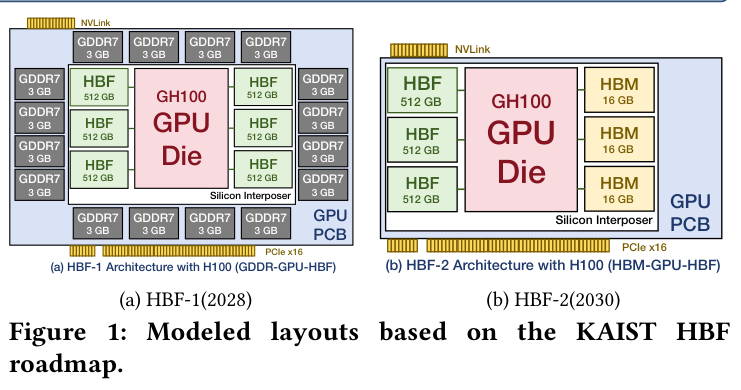
Paper's Figure 1 — the two roadmap organizations under test. HBF-1 (2028) fills the interposer entirely with 6 HBF stacks (3 TB) and pushes the near tier off-package to GDDR7; HBF-2 (2030) splits the interposer 50/50 between 3 HBM stacks and 3 HBF stacks. Both buy flash capacity by halving near-tier capacity and bandwidth — the trade that Finding 1 later shows is fatal.
KV save/load data path #
The runtime is a Mooncake-style pool where flash writes are scheduling decisions off the compute path: new KV lands in the near tier; after a watermark, a background policy flushes cold blocks down; a later matching request restores blocks up before its suffix executes.
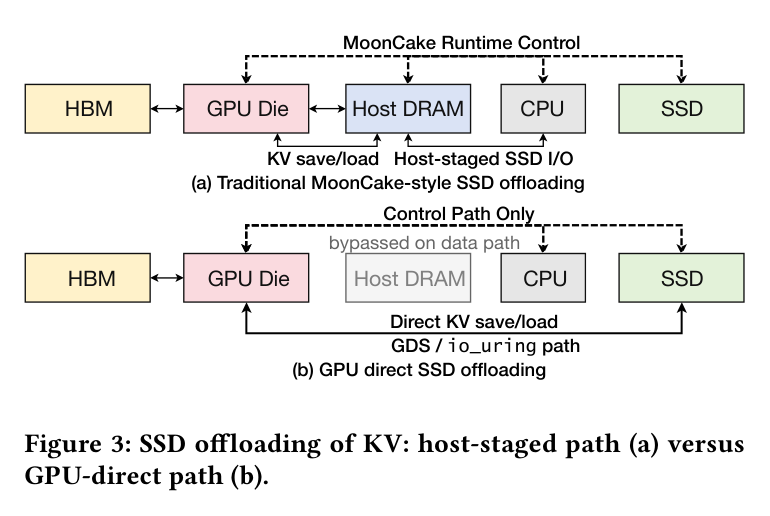
Paper's Figure 3 — the baseline is not a naive path. Modern GDS/io_uring/Tutti paths (b) remove host staging so the SSD baseline is strong; HBF's "shorter path" advantage over this is already narrow.
The request lifecycle and where the scheduler makes its batching decision:
not by HBF speed — this is the bottleneck
The scheduler's queueing discipline is admission-gated continuous batching: the near tier's GB capacity governs how many requests are concurrently admitted. HBF's KV/memory manager allocates in 16-token hash blocks; reuse is served from wherever the block is resident (radix-style prefix match), and the eviction watermark decides what descends to flash.
4. 作者证明 (Author's model) #
The paper is centrally a modeling paper: Eq. (6) is a first-order accounting identity, and Eqs. (7)–(8) are its two testable specializations.
Notation table #
| Symbol | Meaning |
|---|---|
| $\Delta_{\text{HBF}}$ | net change in E2E latency from swapping SSD→HBF (positive = HBF helps) |
| $f$ | fraction of E2E time spent in exposed, non-overlapped secondary-tier I/O |
| $\Delta t_{\text{media}}$ | per-access latency improvement of HBF vs SSD |
| $C_{\text{move}}$ | movement/control overhead from HBF's management requirements |
| $C_{\text{pkg}}$ | opportunity cost of reduced near-tier capacity/bandwidth (the package trade) |
| $C_{\text{var}}$ | cost of thermal throttling and bandwidth variability |
| $C_{\text{life}}$ | endurance and capacity cost |
| $k$ | media speedup factor of HBF vs SSD ($=3.75$ in the sweep) |
| $\rho$ | useful read bytes returned per byte written at the flash tier |
| $\rho^{\star}$ | break-even reads-per-write threshold $=AC/S$ |
| $A$ | write amplification |
| $C$ | per-byte capacity + write-budget cost |
| $S$ | exposed time saved per read byte |
Equations and their physical meaning #
Master identity (Eq. 6):
$$\Delta_{\text{HBF}} = f \Delta t_{\text{media}} - C_{\text{move}} - C_{\text{pkg}} - C_{\text{var}} - C_{\text{life}}.$$
Only the first term is a benefit, and it is gated by $f$ — a faster medium can improve at most the exposed slice. Every other thing HBF changes enters as a subtracted cost. HBF is net-positive only when $\Delta_{\text{HBF}}>0$.
C1 ceiling (Eq. 7):
$$\frac{\Delta T}{T} = f\left(1 - \frac{1}{k}\right) \leq f.$$
Why $\le f$: even an infinitely fast tier ($k\to\infty$) removes only the exposed fraction. The equation is invertible: measure $\Delta T/T$ under a known $k$, solve for $f$. This is the load-bearing move — $f$ becomes a measured quantity, not an assumption.
C2 break-even (Eq. 8):
$$\rho > \rho^{\star} = \frac{AC}{S}.$$
Why $\rho^{\star}>1$ in practice: the write cost is paid unconditionally the moment an object enters HBF, while repaying reads are speculative; and a single NAND program costs several reads in energy and wear ($A$ and $C$ inflate the numerator). So HBF only pays off as a genuinely read-heavy tier.
Sustained-bandwidth bound (Eq. 2, underlying C3):
$$BW_{\text{effective}} = \min(BW_{\text{interface}}, BW_{\text{array}}, BW_{\text{controller}}, BW_{\text{power}}, BW_{\text{thermal}}, BW_{\text{workload}}).$$
The min (not a sum) is the point: delivered bandwidth collapses to whichever limit binds first, and for a write-heavy stream that is $BW_{\text{thermal}}$ / $BW_{\text{power}}$ — well below the interface peak.
Six minimum checks #
The model is analytic and self-consistent; the paper does not overclaim a fitted boundary — it gives the axes and break-even rule, not a calibrated latency×bandwidth curve (a deliberate, stated limitation).
5. 实验与数据 (Experiments) #
C1 — media is off the critical path #
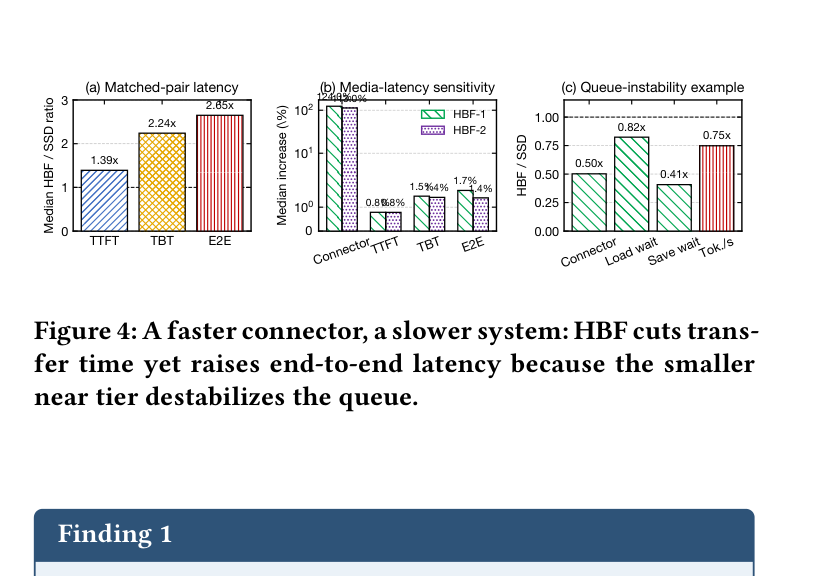
Paper's Figure 4 — the central paradox in one figure. (a) matched-pair medians: HBF/SSD E2E ratio 2.65× despite (b) a media sweep that moves connector time 124% but TTFT/TBT/E2E <2%. (c) the mechanism: HBF cuts connector and save-wait time (0.41–0.50×) yet tokens/s falls to 0.75× because the smaller near tier destabilizes the queue.
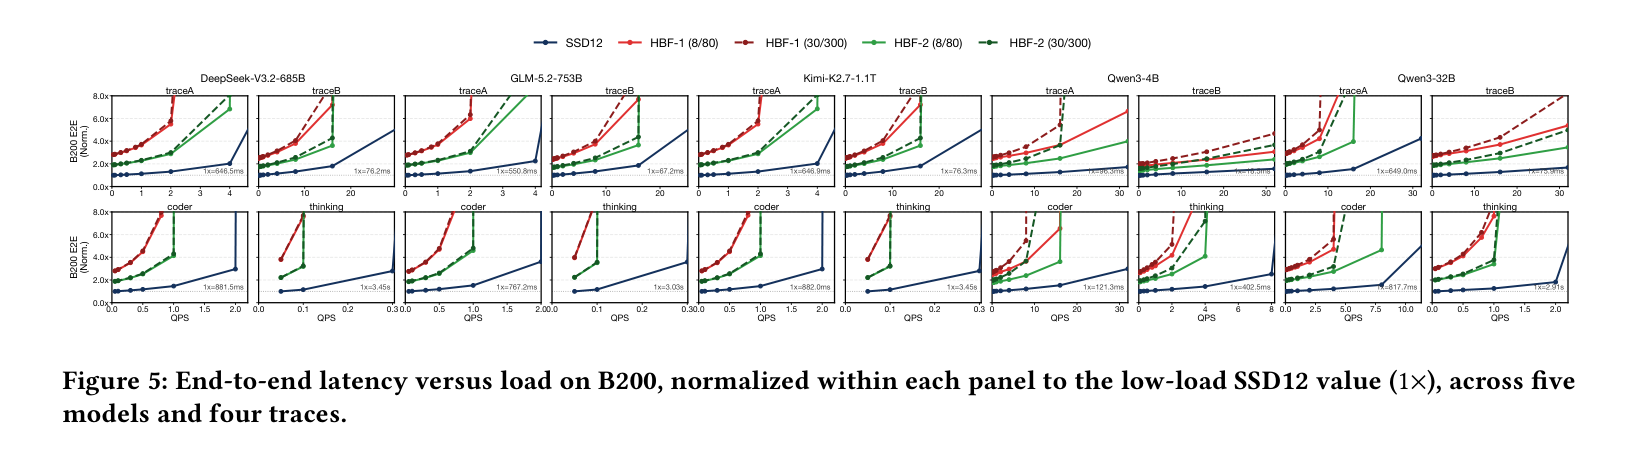
Paper's Figure 5 — across all 5 models × 4 traces, every HBF curve rises above the SSD12 baseline and saturates at lower offered load. The near-tier loss caps admission, so the server tips into queue growth earlier regardless of how fast HBF reads.
| Model (B200) | ΔE2E HBF-1 | ΔE2E HBF-2 | ΔGoodput HBF-1 | ΔGoodput HBF-2 |
|---|---|---|---|---|
| Kimi-K2.7 | +285.2% | +131.4% | −51.7% | −41.7% |
| GLM-5.2 | +280.0% | +133.2% | −37.5% | −12.5% |
| DeepSeek-V3.2 | +284.7% | +131.3% | −51.7% | −41.7% |
| Qwen3-32B | +267.4% | +136.0% | −40.0% | −25.1% |
| Qwen3-4B | +184.1% | +103.4% | −46.3% | −35.9% |
Table 5 — HBF loses on every model, every metric. Even HBF-1, carrying twice HBF-2's flash capacity/bandwidth, is 16–64% slower than HBF-2 end-to-end because the near tier, not the flash, governs serving.
Paper's Figure 8 — the "move compute to the data" escape hatch fails. Under maximally favorable assumptions (no area/power charge, 100% hit for eligible tokens), an HBF base-die attention engine averages −0.03% decode-attention gain vs 42.84% for the equivalent HBM engine, because only 15.48% of KV is HBF-resident. Base-die silicon should go to control, not attention.
C2 — the hierarchy hands HBF a write-heavy stream #
| Metric | traceA | traceB | coder | thinking |
|---|---|---|---|---|
| Write/read ratio | 2.14× | 4.90× | 1.14× | 2.20× |
| $\rho$ (reads/write) | 0.47 | 0.20 | 0.88 | 0.45 |
| Prefix hit rate | 38.21% | 52.46% | 45.58% | 44.12% |
Table 8 — every trace writes more than it reads at the flash tier. The reconciliation with the 38–53% prefix hit rate: reuse is extremely skewed (top decile supplies 64–100% of reuse reads, Gini 0.80–1.0), and those hot blocks stay resident in the near tier. What reaches HBF is the write-once cold tail — the hierarchy doing its job routes the least reusable KV to the device least able to absorb writes.
C3 — thermal throttle and endurance #
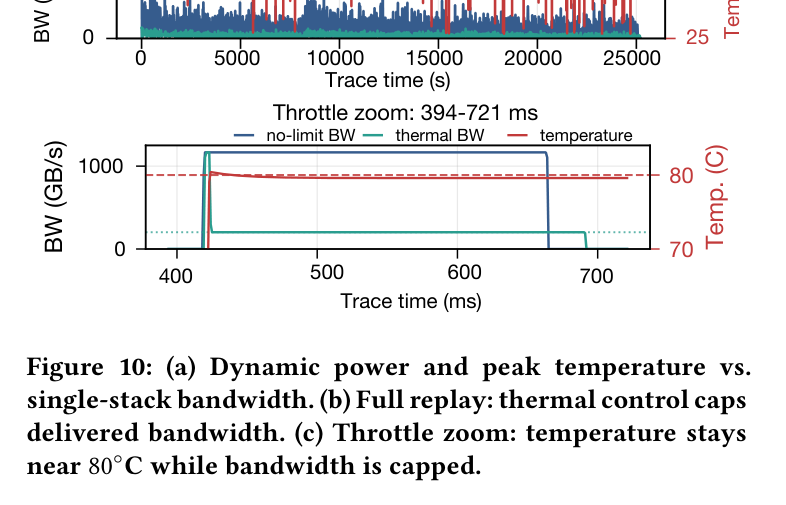
Paper's Figure 10 — (a) power scales linearly with bandwidth; the 16-Hi TLC stack hits the 80 °C junction limit at only 202.27 GB/s / 53.72 W, far below interface peak. (b)–(c) in replay, the thermal controller drops the constrained run to that safe point and holds temperature near 80 °C — delivered bandwidth becomes time- and space-varying, breaking any scheduler that assumes a fixed flash bandwidth.
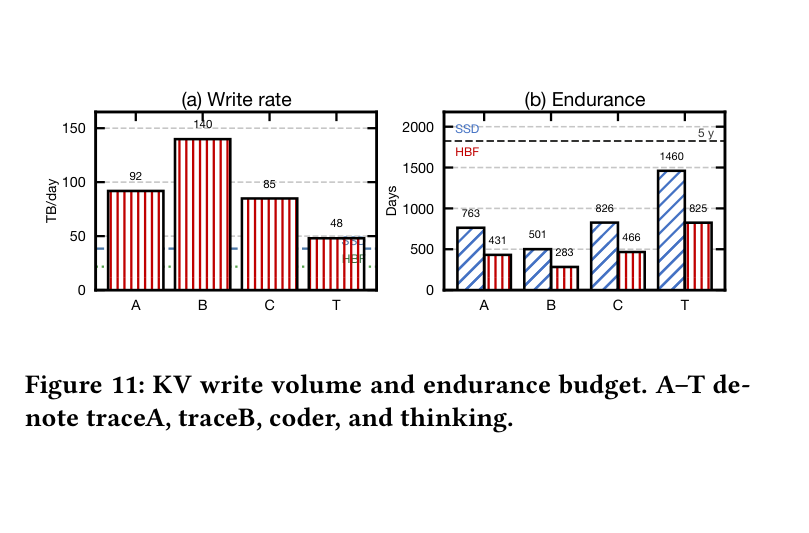
Paper's Figure 11 — every trace writes 48–140 TB/day, past both the SSD (38.4 TB/day, 3-DWPD) and the deliberately-favorable HBF TLC (21.7 TB/day) budgets. Under linear TBW exhaustion the HBF tier lasts a constant 0.56× the SSD pool's life on all four traces. Coarsening blocks 16→512 tokens raises write volume 1.38× (partial reuse rewrites the whole block).
6. 论证链 (Argument chain) #
| Step | Claim | Support (paper-internal) |
|---|---|---|
| 1 | E2E latency change from HBF = one $f$-gated benefit minus four subtracted costs. | Eq. (6) accounting identity, §5. |
| 2 | The benefit is capped by the exposed I/O fraction $f$, and Eq. (7) recovers $f$ from a media sweep. | Eq. (7) invertibility, §5/§6.1. |
| 3 | The measured $f\approx1\%$ (0.75% E2E move at $k=3.75$), so media speed is irrelevant; the loss is the demoted near tier ($C_{\text{pkg}}$ dominates by 2 orders of magnitude). | Fig. 4, Table 5, §6.1 Finding 1. |
| 4 | Moving attention compute onto the base die cannot raise $f$: only 15.48% of KV is HBF-resident, so the engine averages −0.03%. | Fig. 8, Tables 6–7, §6.2 Finding 2. |
| 5 | The two-tier hierarchy keeps reuse in the near tier and sends HBF a write-heavy cold stream: $\rho=0.20$–$0.88 < \rho^{\star}$ on every trace. | Table 8, §7.1 Finding 3. |
| 6 | SSD write-batching does not rescue $\rho$ on HBF (2.69% vs 13.98% gain), because HBF's write cost lacks the random-access penalty batching attacks. | Table 9, Fig. 9, §7.2 Finding 4. |
| 7 | The write-heavy stream thermally throttles delivered bandwidth to 202.27 GB/s (C3 fails on power/thermal). | Fig. 10, §8.1 Finding 5. |
| 8 | The same stream exhausts endurance 0.56× faster than the SSD pool it replaced (C3 fails on lifetime, $C_{\text{life}}$). | Fig. 11, §8.2 Finding 6. |
| 9 | All three necessary conditions fail simultaneously for transient KV → the drop-in swap is net-negative; HBF belongs only in the high-stall, high-$\rho$ corner (weights, shared prefixes). | Fig. 12 placement map, §9.1. |
7. 实现 cross-reference #
[实现未公开] — no artifact release is stated. The evaluation is a simulator study, so the "implementation" is the extended TokenSim [26] plus physical models rather than a serving-system patch:
关键实现细节 (easy-to-miss tricks) #
§10 Deployment context (实践上下文) #
| Workload regime | HBF drop-in | SSD baseline | Why |
|---|---|---|---|
| transient private decode KV | loses (poor fit) | wins | low stall $f$, low $\rho$, write-heavy |
| short-output API traffic (traceB) | worst case | wins | only 6% blocks reused, $\rho=0.20$, 4.90× write/read |
| code multi-turn (coder) | least-bad | wins | highest $\rho=0.88$ but still <1 |
| shared prefixes / weights (read-mostly) | would win (not the deployment here) | — | high stall + $\rho\gg1$; where H3/HAVEN place HBF data |
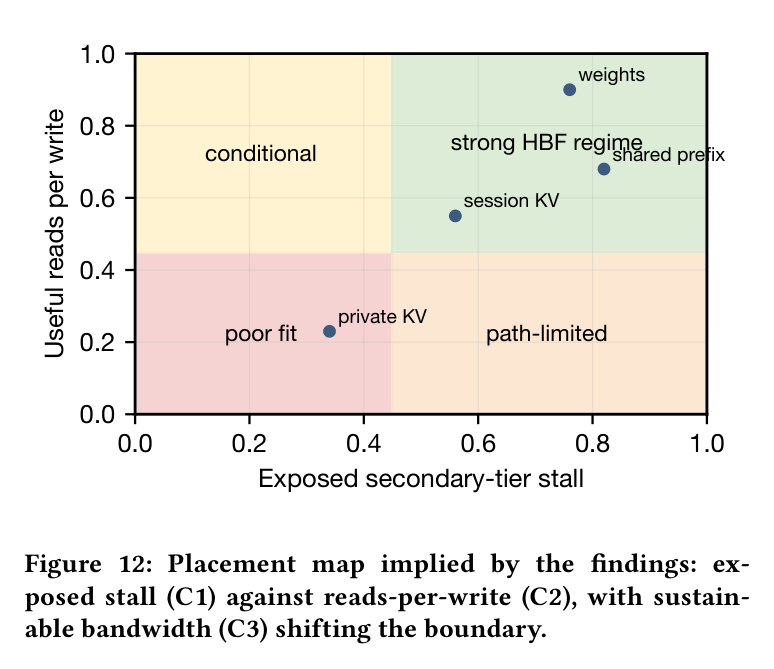
Paper's Figure 12 — the constructive conclusion. Transient decode KV sits in the low-stall/low-$\rho$ "poor fit" corner where all three conditions fail; weights and shared prefixes sit in the "strong HBF regime" corner. HBF is not useless — it is misplaced by an SSD-style hierarchy that routes exactly the wrong object class to it.
§12 Software → Hardware reverse implication #
Triggered — this framework is hardware-proximal (KV physical layout on NAND, base-die control plane, thermal-aware plane throttling, package interposer budget). The reverse implications the paper's complexity argues for: