Towards a Science of Scaling Agent Systems
Towards a Science of Scaling Agent Systems — L2 #
1. TL;DR #
Controlled sweep of 260 configs (5 architectures × 9 models × 6 agentic benchmarks) fits a predictive model ($R^2_{CV}=0.41$) showing multi-agent coordination helps only when single-agent baseline is below ~45% and the task decomposes; otherwise it degrades performance (−70% worst case) and burns 3–5× tokens.
2. Q1 / Q2 / Q3 #
Q1 — 痛点 (pain point) #
Practitioners deciding whether to build a multi-agent system (MAS) or a single-agent system (SAS) have only heuristics. Prior MAS-vs-SAS studies confound architecture with implementation: they compare systems built with different prompts, tools, and compute budgets, so a reported MAS "win" may just be a bigger budget. Worse, MAS results from static benchmarks (where five agents reach 89% on HumanEval through ensemble voting) do not transfer to agentic tasks — those requiring sustained environment interaction, information gathering under partial observability, and adaptive strategy. On agentic tasks, coordination overhead scales with interaction depth, parallel agents drift to divergent world states (34% trajectory overlap after 10 interactions), and errors cascade through execution chains instead of cancelling via voting. The scope is open-ended agentic task classes (browser, coding, finance, CLI, planning), multi-turn interaction, mostly fully-autonomous runs.
Q2 — 方法 (method) #
Build a controlled evaluation apparatus that standardizes tools, prompts, and total compute budget across architectures, isolating the coordination topology as the only free variable. Five canonical architectures are instantiated: SAS plus four MAS topologies distinguished purely by their communication graph $C$ — Independent (agent→aggregator only), Centralized (orchestrator→agents), Decentralized (all-to-all debate), Hybrid (orchestrator + limited peer). Each runs over three LLM families (OpenAI, Google, Anthropic) at varying capability tiers (Intelligence Index 42–71) on six agentic benchmarks. From the 260 runs, fit a regression (Eq. 1) over base capability, tool count, agent count, single-agent baseline, and empirical coordination metrics, then invert it into an architecture-selection rule.
核心技术壁垒 (THE single hardest-to-replicate insight): the apparatus establishes compute-matched fairness — MAS teams receive the same total reasoning-token budget as SAS (mean 4,800 tokens/trial), achieved by giving each of $n$ agents a proportionally thinner per-agent iteration budget. This single design choice is what lets the paper attribute performance deltas to coordination structure rather than to extra compute, and it is exactly what prior comparisons failed to control. Reproducing the headline findings requires reproducing this budget-partitioning discipline, not just the topologies.
Q3 — 结果 (result) #
- Mean MAS improvement over SAS is −0.3% (95% CI $[-58.7\%, +77.2\%]$, $\sigma=37.5\%$) — i.e. on average MAS buys nothing, with enormous task-dependent variance.
- Range spans +80.8% (Finance, Centralized) to −70.0% (PlanCraft, Independent).
- Capability-saturation: once SAS baseline $P_{SA} > 45\%$, adding agents yields negative returns. This is the single most statistically robust finding (survives cluster-robust inference $p=0.004$ and Holm–Bonferroni $p_{Holm}=0.018$).
- Centralized verification contains trace-level error amplification to $4.4\times$; Independent (no verifier) amplifies $17.2\times$.
- The fitted model selects the best architecture for 87% of held-out configurations (vs. 20% random, 54% capability-only).
3. 架构 / 方法图 (architecture) #
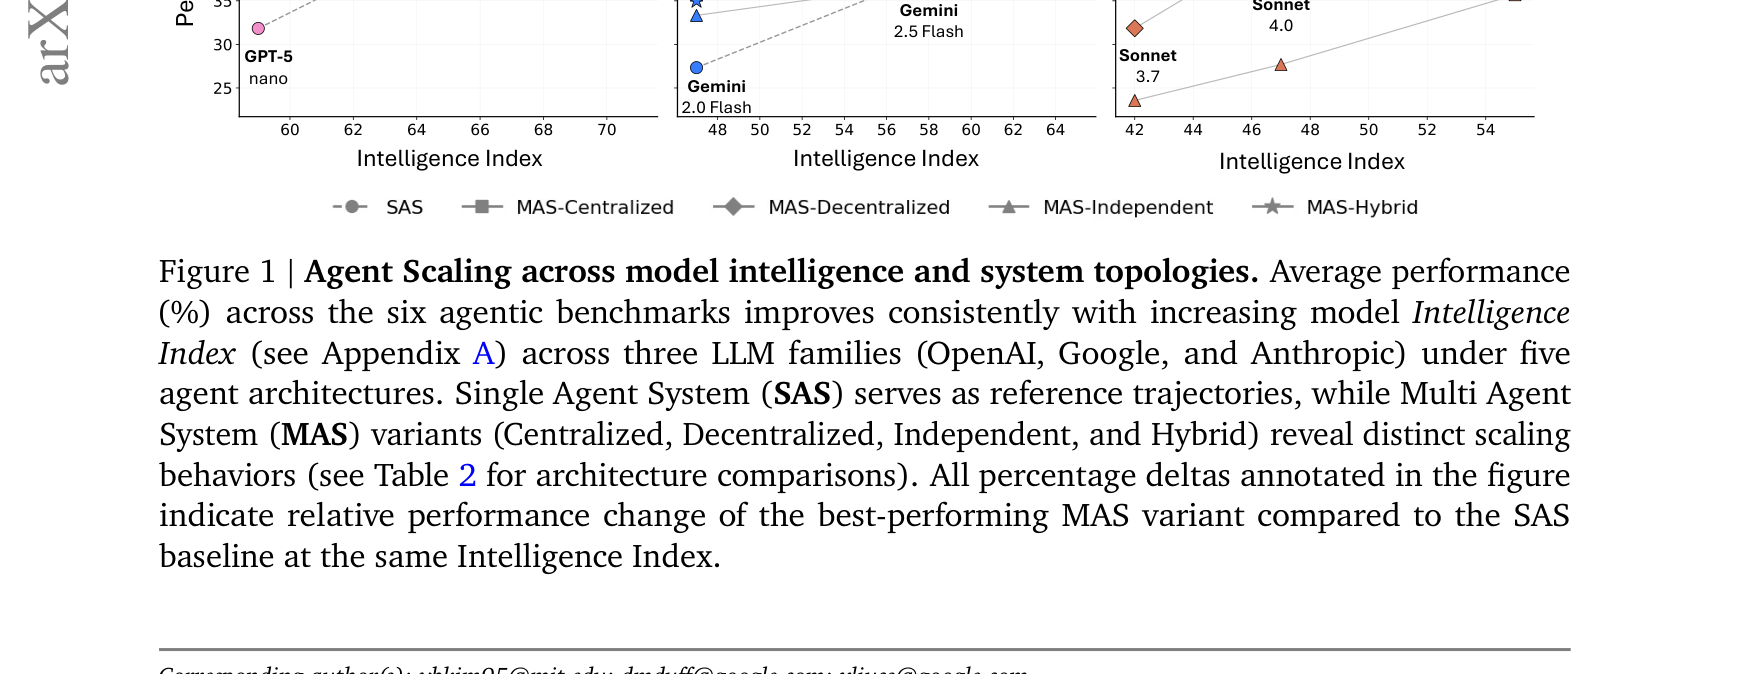
Paper's Figure 1. Average agentic performance (%) plotted against model Intelligence Index for the five topologies across all six benchmarks. The figure's load-bearing message is that performance rises monotonically with base-model capability regardless of topology, but the ranking of topologies is task-dependent — no single curve dominates, which is the empirical seed of the whole paper.
The system is formalized as $\mathcal{S}=(A,E,C,\Omega)$ where $A$ is the agent set, $E$ the shared environment, $C$ the communication topology, and $\Omega$ the orchestration policy. The four MAS variants differ only in $C$ and $\Omega$: Independent uses $C=\{(a_i,a_\text{agg})\}$ with $\Omega=\texttt{synthesis\_only}$; Centralized uses $C=\{(a_\text{orch},a_i)\}$ with a hierarchical $\Omega$ over $r$ rounds; Decentralized uses all-to-all $C=\{(a_i,a_j)\}$ with consensus over $d$ debate rounds; Hybrid is $C_\text{centralized}\cup C_\text{peer}$.
The agent loop (one turn). Each agent is a tuple $(\Phi_i, \mathcal{A}_i, M_i, \pi_i)$ — LLM reasoning policy, tool-call action space, memory, and decision function. One turn executes $\alpha_{i,t}=\pi_i(h_{i,t})$, $o_{i,t}=E(\alpha_{i,t})$, $h_{i,t+1}=f_i(h_{i,t},\alpha_{i,t},o_{i,t})$, with history truncated when $|h_{i,t+1}| > \text{MAX\_TOKENS}$.
The MAS-specific Coordinate state is where the coordination tax is paid: global context must be compressed into inter-agent messages, so parallel agents progressively diverge. Error recovery differs by topology — Centralized/Decentralized route sub-agent outputs through an orchestrator cross-check or peer debate before aggregation (22.7% average error reduction), whereas Independent has no verification bottleneck and instead amplifies errors (+4.6%). Planning style is a predetermined workflow (fixed round/debate counts), not adaptive tree search; there is no backtracking — agents cannot undo environment actions.
Memory model: short-term is the per-agent context window $M_i$; there is no long-term vector store — coordination memory persists only across $r$/$d$ rounds and costs $O(rnk)$ / $O(dnk)$. Budget is bounded: SAS gets max 10 iterations; Centralized gets 3 sub-agents + orchestrator, max 5 rounds, 3 iterations/agent/round (Appendix E).
4. 作者证明 (author's argument / formal model) #
The paper offers no convergence or success guarantee — as is typical for agent work, the central claim is an empirical predictive model, not a proof. What could have been bounded (but is not) is a worst-case error-amplification bound as a function of topology depth. Below is the notation and the six-check validation of the load-bearing regression.
Notation table #
| Symbol | Meaning |
|---|---|
| $I$ | Intelligence Index (base-model capability, centered as $I-\bar I$, $\bar I=57.5$) |
| $T$ | tool count available to the task ($\{2,3,4,5,7,16\}$) |
| $n_a$ | number of agents |
| $P_\text{SA}$ | single-agent baseline accuracy on the task |
| $E_c$ | coordination efficiency $= S/(T_\text{tokens}/T_\text{SAS})$ |
| $O\%$ | coordination overhead $=(T_\text{MAS}-T_\text{SAS})/T_\text{SAS}\times 100$ |
| $A_e^\text{trace}$ | trace-level error amplification vs. SAS |
| $c$ | message density (inter-agent messages per turn) |
| $R$ | redundancy (mean cosine similarity of agent outputs) |
Equation 1 — the predictive model (physical meaning) #
The response $P$ (agentic performance) is a quadratic-in-capability, log-in-skewed-counts regression with 10 interaction terms:
$$P=\beta_0 + \beta_1(I-\bar I) + \beta_2(I-\bar I)^2 + \beta_3\log(1+T) + \beta_4\log(1+n_a) + \beta_{10}P_\text{SA} + \sum_{\text{interactions}}\beta_j(\cdot) + \varepsilon$$
Physical meaning: the two load-bearing interaction terms are $\beta_{17}\,P_\text{SA}\times\log(1+n_a)=-0.236$ (the baseline paradox — adding agents hurts when the baseline is already high) and $\beta_{E_c\times T}=-0.096$ (the efficiency–tools trade-off — coordination efficiency collapses as tool count rises). The architecture decision boundary is derived by setting the agent-count gradient to zero: $P_\text{SA}^{*}=-\beta_4/\beta_{17}\approx 0.040/0.236 = 0.170$ in standardized units, which denormalizes to the 45% raw-accuracy threshold.
Six minimum checks #
- Dimensional / sign sanity. $\beta_1(I-\bar I)=+0.126$ ($p=0.008$): higher capability → higher performance. Correct sign, linear within $I\in[42,71]$; quadratic term insignificant ($p=0.977$). ✓
- Collinearity controlled. Centering $I$ drops VIF from 200 → 1.1; all VIF < 5. The one deliberate exception ($A_e^\text{trace}\times T$ kept un-logged) is justified: logging would push VIF > 8. ✓
- Boundary case. As $n_a\to 1$, $\log(1+n_a)$ terms shrink and $P\to\beta_0+\beta_1(I-\bar I)+\beta_{10}P_\text{SA}$ — i.e. reduces to a sensible SAS capability model. ✓
- Monotonicity along error axis. Trace error amplification is monotone in verification absence: SAS $1.0$ < Centralized $4.4$ < Hybrid $5.1$ < Decentralized $7.8$ < Independent $17.2$. Matches the "verification bottleneck" mechanism. ✓
- Decision-boundary reproduces data. The derived 45% threshold is independently validated at 94% match rate across 16 model×benchmark cells on SWE-bench + Terminal-Bench ($p<0.001$, binomial). ✓
- Out-of-sample holds. On three unseen frontier models (Index=75, 5.6% extrapolation), MAS-only MAE=0.061 and the capability-ceiling finding validates 3/3. ✓
- Orchestration stack: LiteLLM (unified provider API) + LangChain (agent orchestration / tool integration), with API-key rotation for rate limits and automatic context-window truncation at token limits (Appendix E, "Technical Infrastructure").
- Architecture budgets (Appendix E, "Agent Configuration"): SAS max 10 iterations; Independent = 3 agents, synthesis-only; Centralized = 3 sub-agents + 1 orchestrator, max 5 rounds × 3 iterations; Decentralized = 3 agents × 3 debate rounds × 3 iterations; Hybrid = centralized + peer phases.
- Prompt system: YAML templates with double-brace variable interpolation (Appendix E, "Prompt System").
- Models (Appendix E): OpenAI
gpt-5{,-mini,-nano}, Googlegemini-2.{0,5}-{flash,pro}, Anthropicclaude-{3.7,4.0,4.5}-sonnet. - Capability metric swap matters. Using ACI (each model's mean single-agent performance across the six benchmarks) instead of the static Intelligence Index raises $R^2_{CV}$ from 0.373 → 0.413 with zero finding reversals — because static composites correlate only $r=0.45$ with real agentic capability. The recommended predictor is ACI, not the headline Intelligence Index.
- Centering before regression is load-bearing, not cosmetic. Centering $I$ at $\bar I=57.5$ collapses VIF from 200 to 1.1; without it the capability terms are uninterpretable. Similarly,
total message countis dropped entirely ($r>0.92$ with overhead) to avoid a silent collinearity trap.
Residual caveat (fails strict check): under cluster-robust inference ($G=6$ clusters) only single_agent_baseline survives at $\alpha=0.05$; log_tools and efficiency_x_tools inflate to $p>0.17$ — directional but not independently significant with so few clusters.
5. 实验与数据 (experiments & data) #
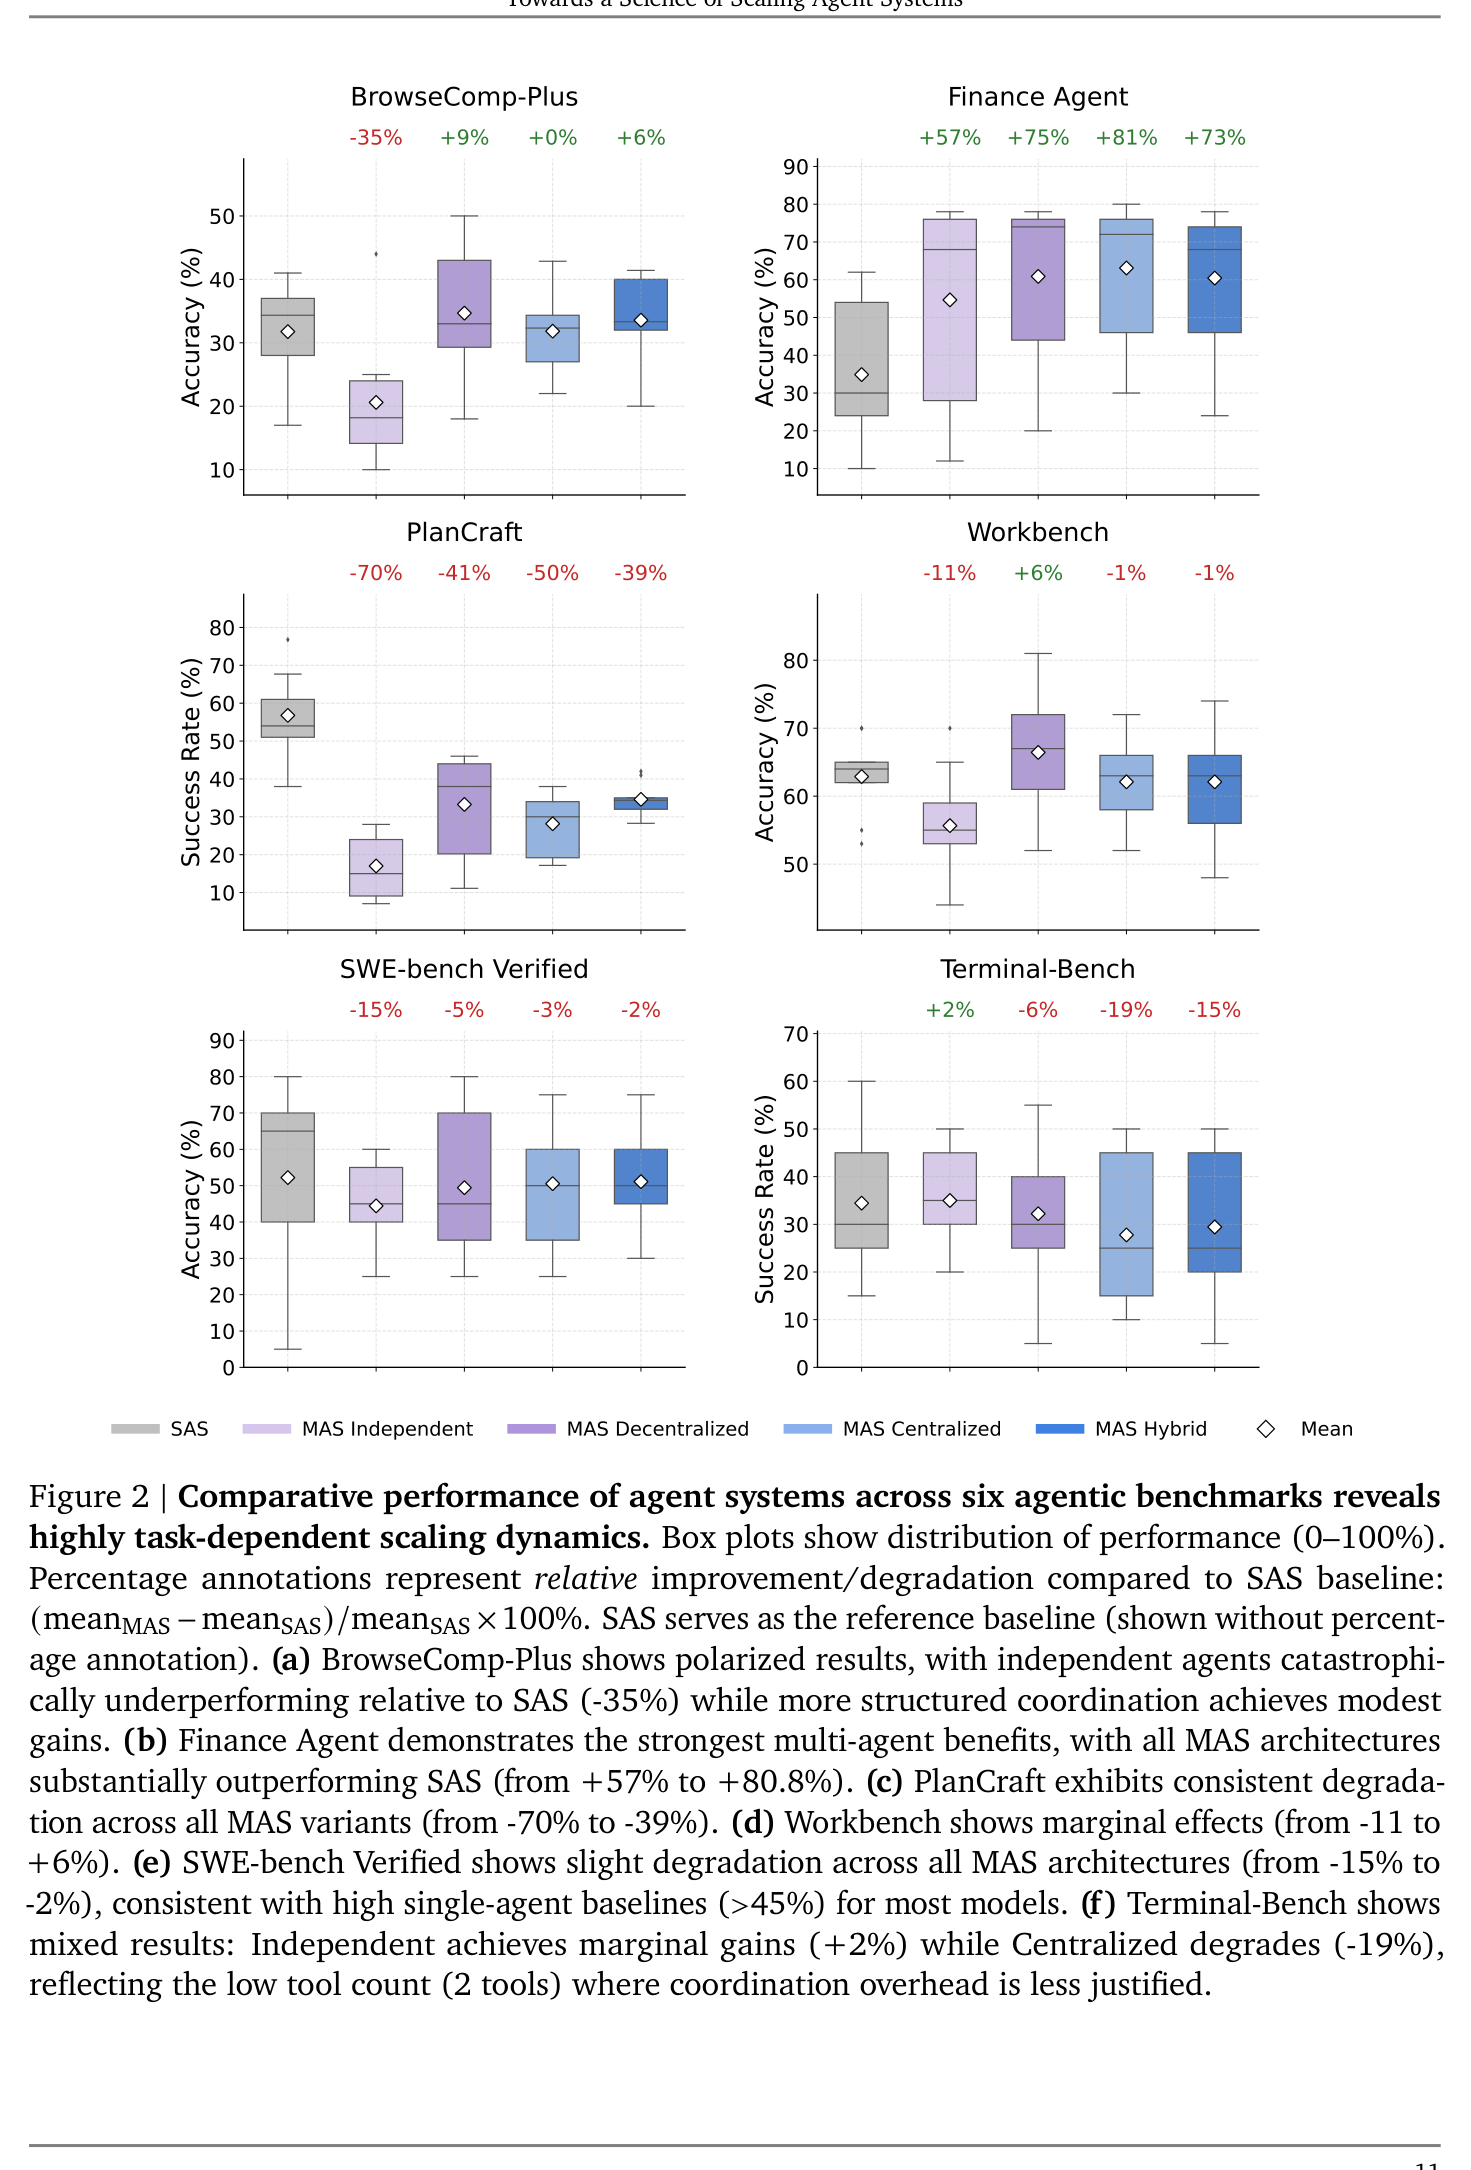
Paper's Figure 2. Box plots of performance per architecture per benchmark; percentage annotations are relative change vs. the SAS baseline. The reader should notice the sign flip across panels: (b) Finance is uniformly positive (+57% to +80.8%) while (c) PlanCraft is uniformly negative (−70% to −39%) despite near-identical domain complexity ($D=0.407$ vs $0.419$). This is the paper's cleanest demonstration that sequential interdependence, not complexity magnitude, decides coordination viability — Finance decomposes into parallel sub-analyses, PlanCraft is a strict ordered chain.
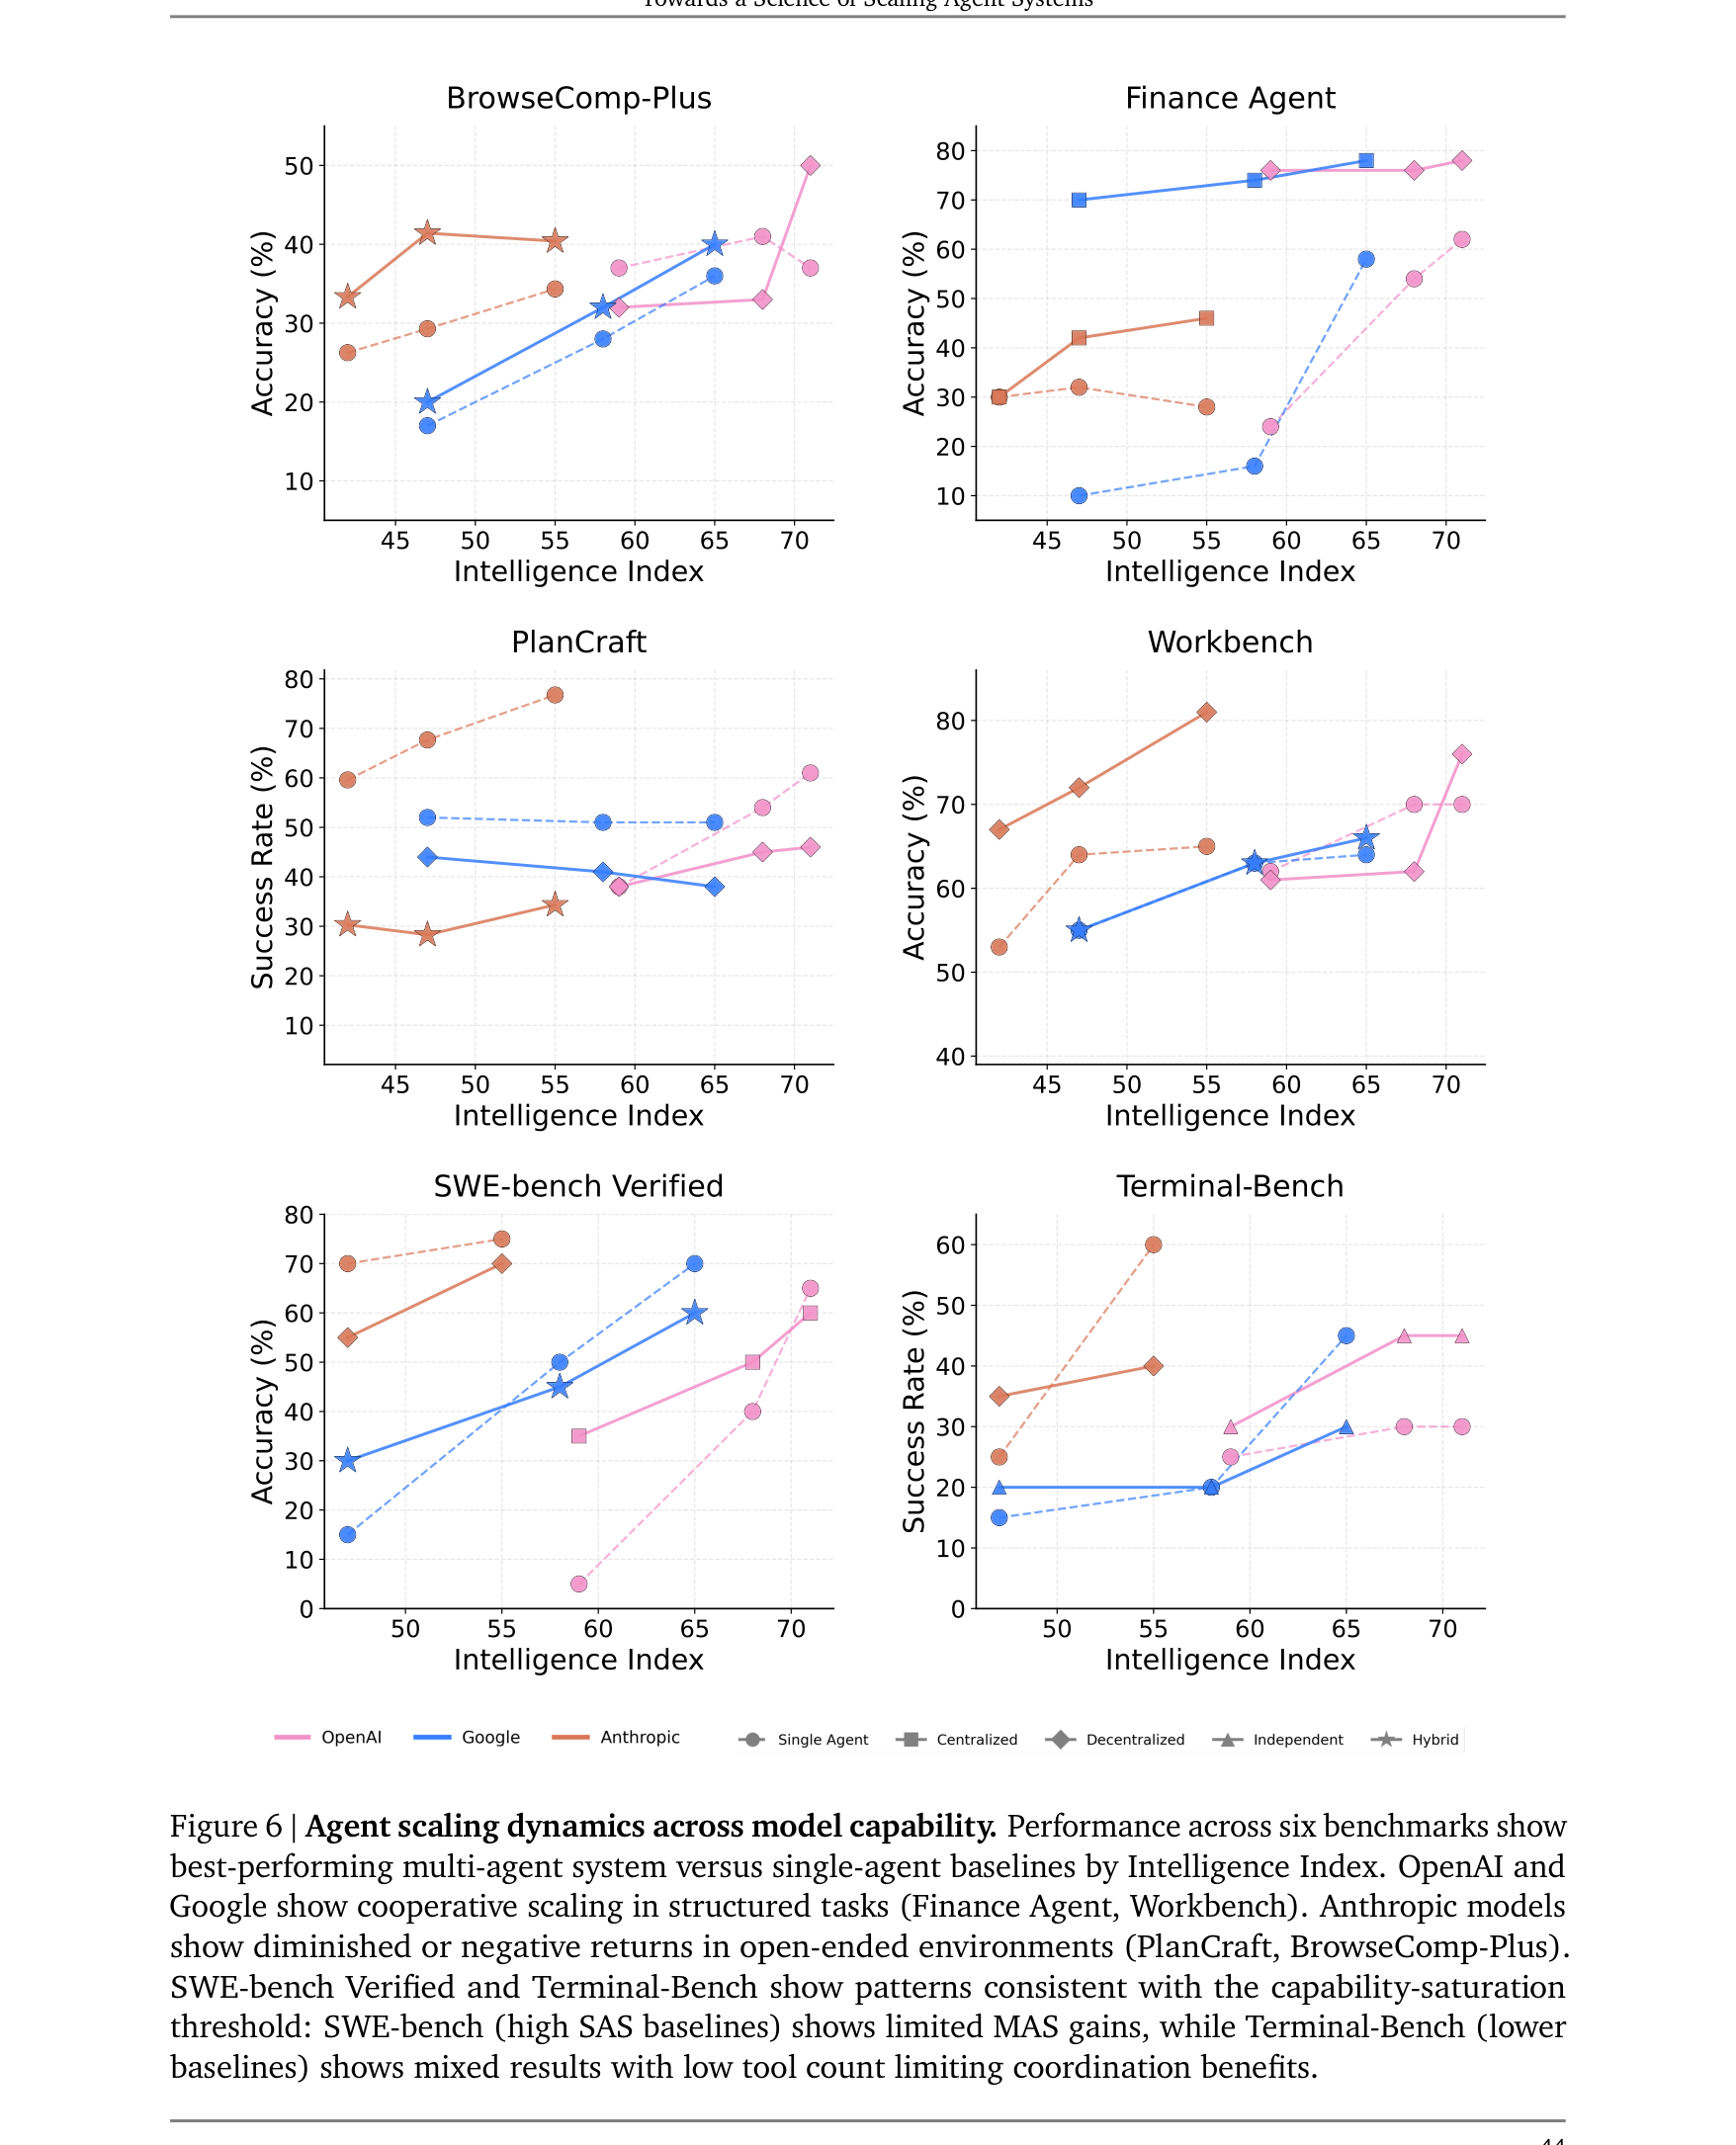
Paper's Figure 6. Best-performing MAS vs. SAS by Intelligence Index, per benchmark. Panels (e) SWE-bench and (f) Terminal-Bench are the capability-ceiling evidence: SWE-bench's high SAS baselines (>45%) leave almost no MAS headroom, while Terminal-Bench's lower baselines plus its 2-tool minimalism give mixed, mostly-flat MAS returns. Note the family split — OpenAI/Google curves climb with cooperative scaling while Anthropic curves flatten or dip, foreshadowing Figure 3.
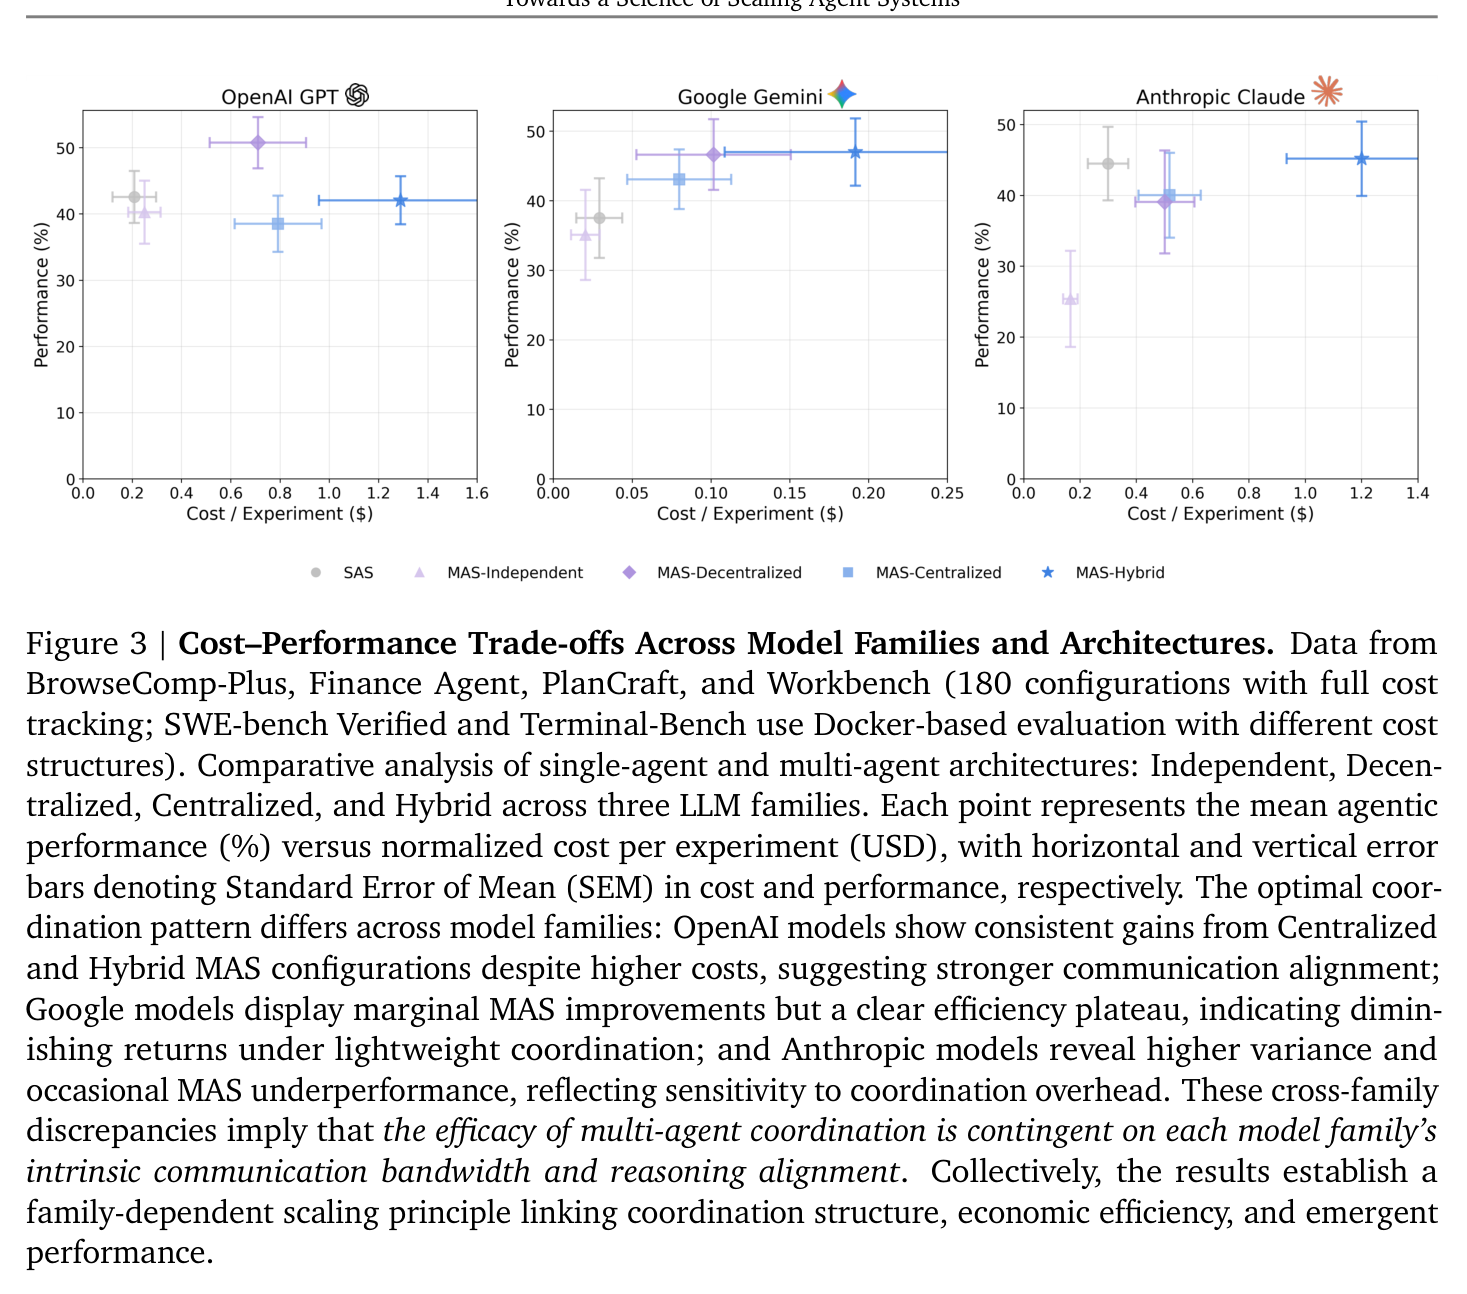
Paper's Figure 3. Mean performance vs. dollar cost per experiment, per family. The horizontal spread is the real story: MAS configurations sit far to the right (expensive) for only marginal vertical (performance) gain. The embedded coordination metrics quantify this — token efficiency (success per 1K tokens) falls 5× from SAS (67.7) to Hybrid (13.6) while Hybrid's success is only 3% below SAS, so practitioners pay 5× for essentially flat average accuracy.
Coordination metrics (Table 5, verbatim values). The mechanistic backbone: as topology complexity grows, turns and overhead explode super-linearly while efficiency collapses.
| Metric | SAS | Independent | Decentralized | Centralized | Hybrid |
|---|---|---|---|---|---|
| Success $S$ | 0.466 | 0.370 | 0.477 | 0.463 | 0.452 |
| Turns $T$ | 7.2 | 11.4 | 26.1 | 27.7 | 44.3 |
| Overhead $O\%$ | 0 | 58 | 263 | 285 | 515 |
| Msg density $c$ | 0.00 | 0.00 | 0.41 | 0.39 | 0.24 |
| Redundancy $R$ | 0.00 | 0.48 | 0.50 | 0.41 | 0.46 |
| Efficiency $E_c$ | 0.466 | 0.234 | 0.132 | 0.120 | 0.074 |
| Error amp $A_e^\text{trace}$ | 1.0 | 17.2 | 7.8 | 4.4 | 5.1 |
| Success/1K tok | 67.7 | 42.4 | 23.9 | 21.5 | 13.6 |
Turn count follows a super-linear power law $T=2.72\times(n+0.5)^{1.724}$ ($R^2=0.974$), distinct from the $b=0.76$ exponent of dense-model parameter scaling — coordination cost grows faster than compute. Message density saturates logarithmically, $S=0.73+0.28\ln(c)$ ($R^2=0.68$), with the optimum at only $c^{*}\approx 0.39$ messages/turn; past that, Hybrid's 515% overhead buys a statistically insignificant −2.4% vs. Centralized.
Failure-mode classification. Four error classes are tracked; Centralized's orchestrator synthesis is the dominant fix (Context Omission 25.2%→8.3%, a 66.8% cut; Logical Contradiction cut 36.4%). The MAS-specific class is Coordination Failure, which Hybrid uniquely inflates to 12.4% (vs. Independent 0%). Three operating regimes emerge: under-coordination ($O<100\%$, negligible gain), an optimal band ($200\%
6. 论证链 (argument chain, paper-internal) #
| # | Step | Evidence in paper |
|---|---|---|
| 1 | Define agentic tasks (sequential interdependence + partial observability + adaptive strategy) and pick six benchmarks meeting them; standardize tools, prompts, and total token budget across all five architectures. | §3.2, §4.1; budget mean 4,800 tok/trial |
| 2 | Run 260 compute-matched configs; observe MAS gain is task-dependent (+80.8% to −70.0%, mean −0.3%) with no dominant architecture. | §4.2, Figure 2 |
| 3 | Trace the mechanism: turns scale $\propto n^{1.724}$, efficiency drops 2–6×, and error amplification rises with absence of a verification bottleneck (4.4× Centralized vs 17.2× Independent). | §4.4, Table 5 |
| 4 | Fit Eq. 1 over capability, tools, agents, baseline, and coordination metrics; the baseline×agents and efficiency×tools interactions dominate. | §4.3, Table 4 |
| 5 | Invert the agent-count gradient to a decision boundary $P_\text{SA}^{*}\approx 45\%$; validate it (94% match) and the whole selector (87% held-out accuracy). | §4.3, §4.5 |
| 6 | Stress-test under cluster-robust + Holm–Bonferroni + out-of-sample frontier models; capability saturation is the one finding that survives everywhere. | §4.5, Appendix B |
7. 实现 cross-reference #
[实现未公开] — no public code repository is cited. The paper is reproducible only from the configuration prose in Appendix E:
核心技术壁垒 (dedicated paragraph). The irreplaceable asset is the compute-matched comparison protocol, not the topologies (which are standard). Because each MAS agent is throttled to a per-agent slice of a fixed global token budget, any observed MAS win cannot be dismissed as "it just used more compute." This inverts the usual confound in MAS literature and is the precondition for Eq. 1 being a statement about structure. Anyone re-running these experiments without enforcing token-budget parity will measure a different, inflated MAS advantage and fail to reproduce the capability-saturation boundary.
关键实现细节 (easy-to-miss tricks).